Fig. 5
Download original image
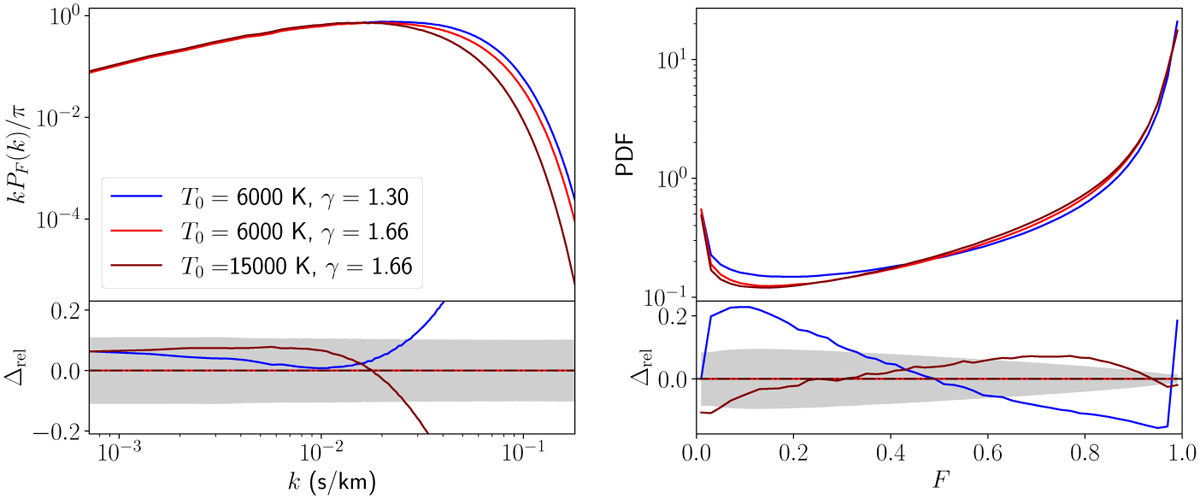
Transmission power spectrum (left) and transmitted PDF (right) computed from our set of 105 skewers for three TDR parameter combinations; the same as in Figure 3. The fractional differences between different TDR cases are shown in the corresponding bottom panels with the gray-shaded areas as 1σ uncertainty ranges (bands drawn from discrete k-modes in TPS and discrete histogram bins in TPDF), equivalent of 100 spectra.
Current usage metrics show cumulative count of Article Views (full-text article views including HTML views, PDF and ePub downloads, according to the available data) and Abstracts Views on Vision4Press platform.
Data correspond to usage on the plateform after 2015. The current usage metrics is available 48-96 hours after online publication and is updated daily on week days.
Initial download of the metrics may take a while.