Fig. 4
Download original image
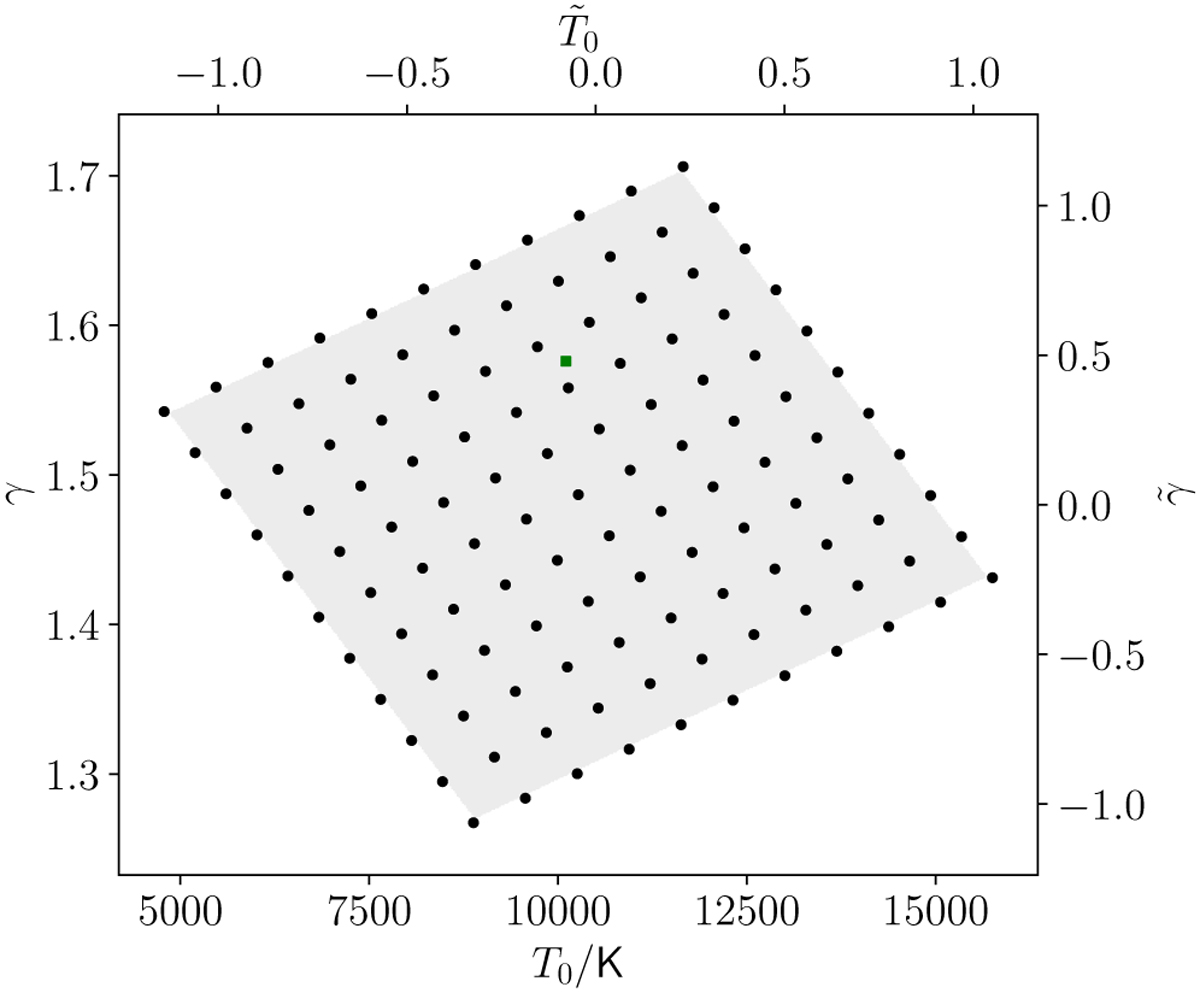
Our sample of thermal models for the various training and test purposes that contains 11×11 (121) distinct (T0, γ) combinations. The fiducial TDR parameter combination is depicted as the green square. The rescaled ![]() axes are also shown for context (see Section 3.1). This is a uniform grid in a parametrization that captures the well known degeneracy direction in the (T0, γ) space. The gray-shaded area shows our prior range in this parameter space. Please refer to Appendix B for more details regarding the strategy used for this sampling.
axes are also shown for context (see Section 3.1). This is a uniform grid in a parametrization that captures the well known degeneracy direction in the (T0, γ) space. The gray-shaded area shows our prior range in this parameter space. Please refer to Appendix B for more details regarding the strategy used for this sampling.
Current usage metrics show cumulative count of Article Views (full-text article views including HTML views, PDF and ePub downloads, according to the available data) and Abstracts Views on Vision4Press platform.
Data correspond to usage on the plateform after 2015. The current usage metrics is available 48-96 hours after online publication and is updated daily on week days.
Initial download of the metrics may take a while.