Open Access
Fig. C.2
Download original image
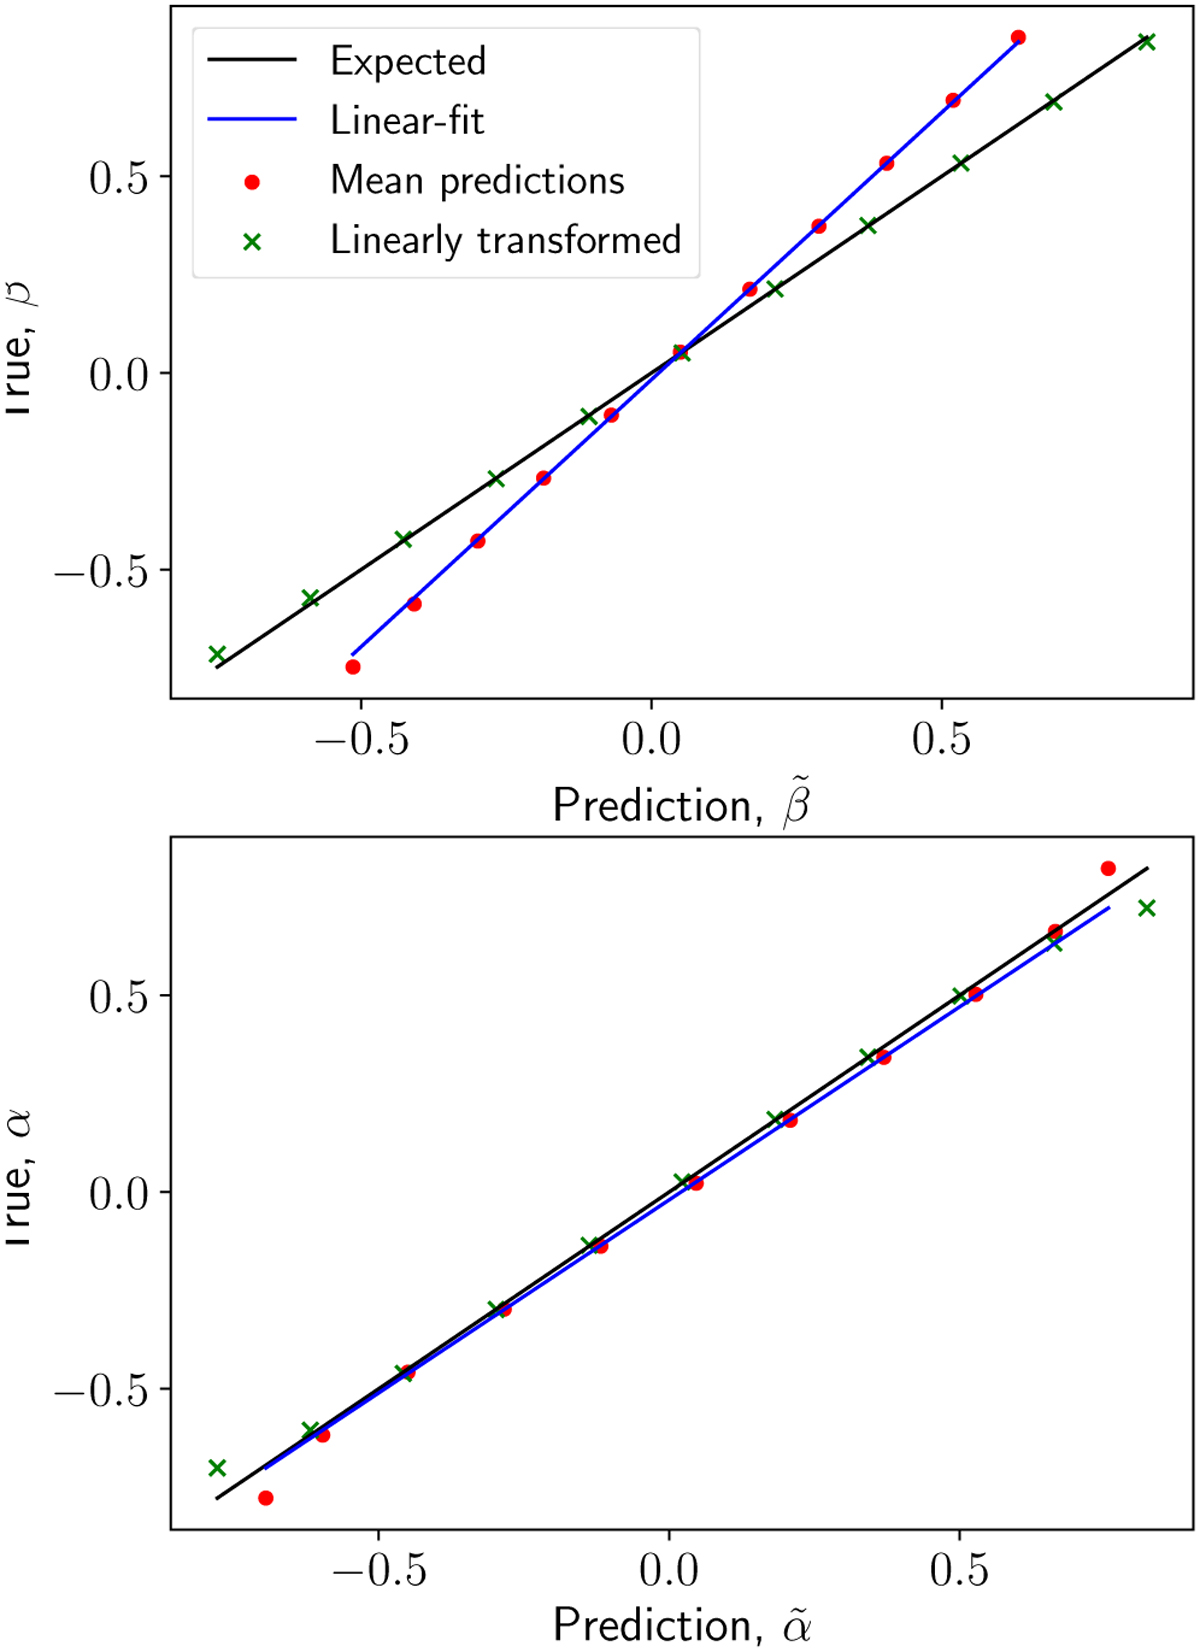
Mean point predictions on the validation set from a network trained on an extended grid as shown in Figure C.1 and a straight line fit of each independent orthogonal parameter (averaged over the other). The mean predictions after applying the linear transformation can be seen to follow the expected y = x behavior.
Current usage metrics show cumulative count of Article Views (full-text article views including HTML views, PDF and ePub downloads, according to the available data) and Abstracts Views on Vision4Press platform.
Data correspond to usage on the plateform after 2015. The current usage metrics is available 48-96 hours after online publication and is updated daily on week days.
Initial download of the metrics may take a while.