Fig. A.3
Download original image
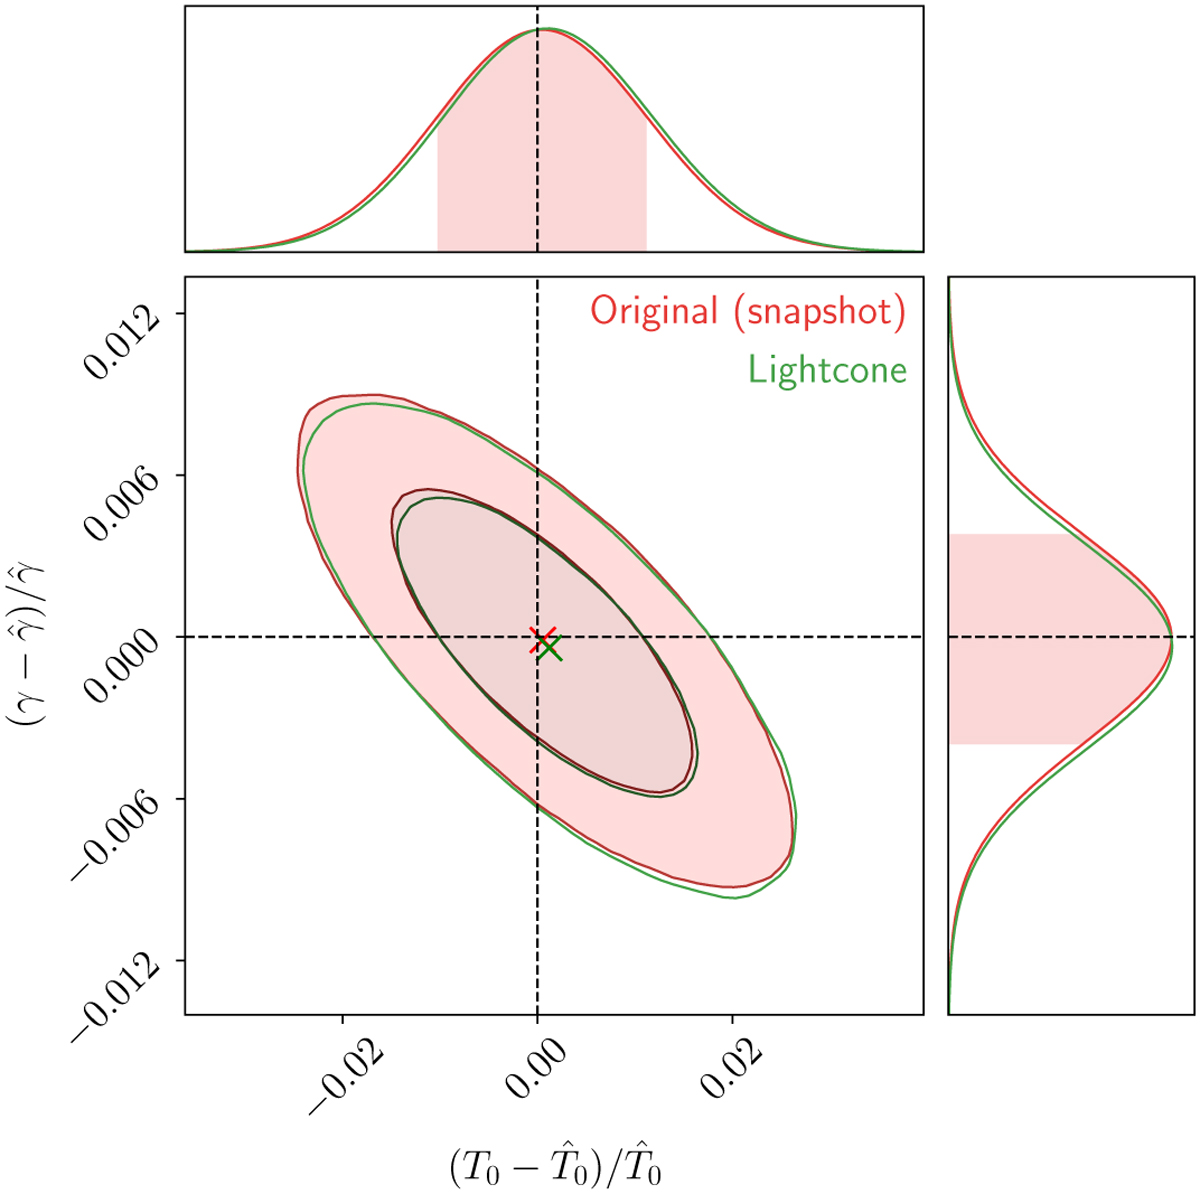
Comparison of posterior contours between the original (snapshot) and approximate lightcone model test cases. Both carry information equivalent to 100 skewers. A mean (expectation) value of the posterior distributions are also shown with crosses of the corresponding colors. In both the cases, statistically inter-consistent posterior distributions are obtained, recovering the fiducial TDR of the snapshot.
Current usage metrics show cumulative count of Article Views (full-text article views including HTML views, PDF and ePub downloads, according to the available data) and Abstracts Views on Vision4Press platform.
Data correspond to usage on the plateform after 2015. The current usage metrics is available 48-96 hours after online publication and is updated daily on week days.
Initial download of the metrics may take a while.