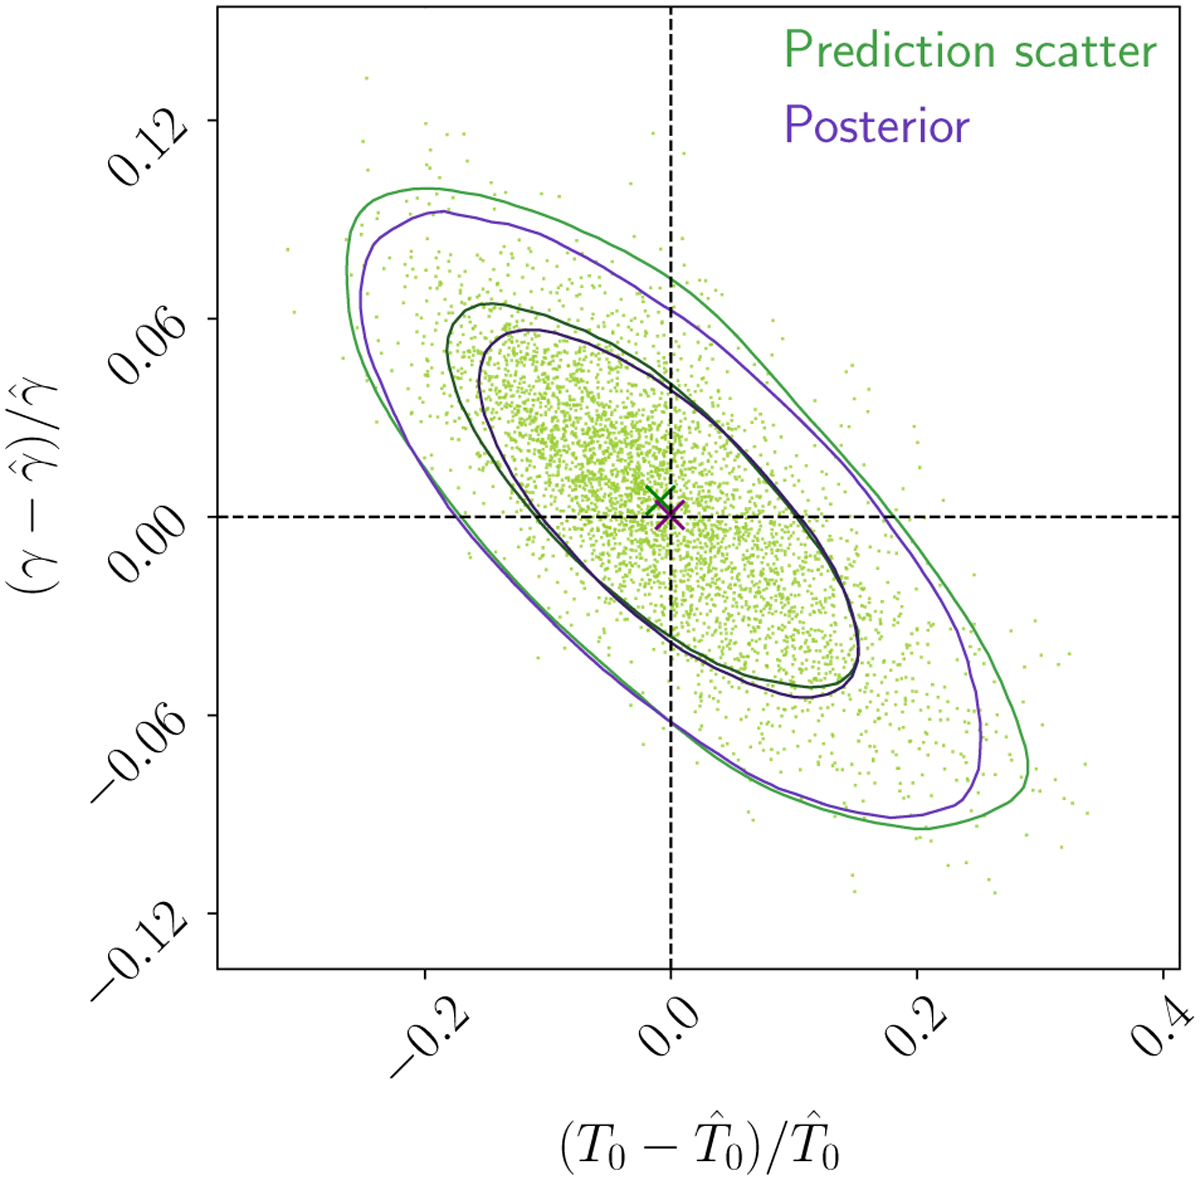
Fig. 10

Download original image
Scatter of point predictions for the original test set of spectra from our fiducial TDR model shown here with the 68 and 95% contours (green). The contours of the posterior distribution (purple) obtained by SANSA with the procedure outlined in Section 3.1, inflated to match the information equivalent to one spectrum, follow the scatter contours very closely. SANSA also recovers the true parameters (dashed) with a very good accuracy, as indicated by the mean of the point prediction scatter (green cross) as well as that of the posterior (purple cross).
Current usage metrics show cumulative count of Article Views (full-text article views including HTML views, PDF and ePub downloads, according to the available data) and Abstracts Views on Vision4Press platform.
Data correspond to usage on the plateform after 2015. The current usage metrics is available 48-96 hours after online publication and is updated daily on week days.
Initial download of the metrics may take a while.


