Fig. 6
Download original image
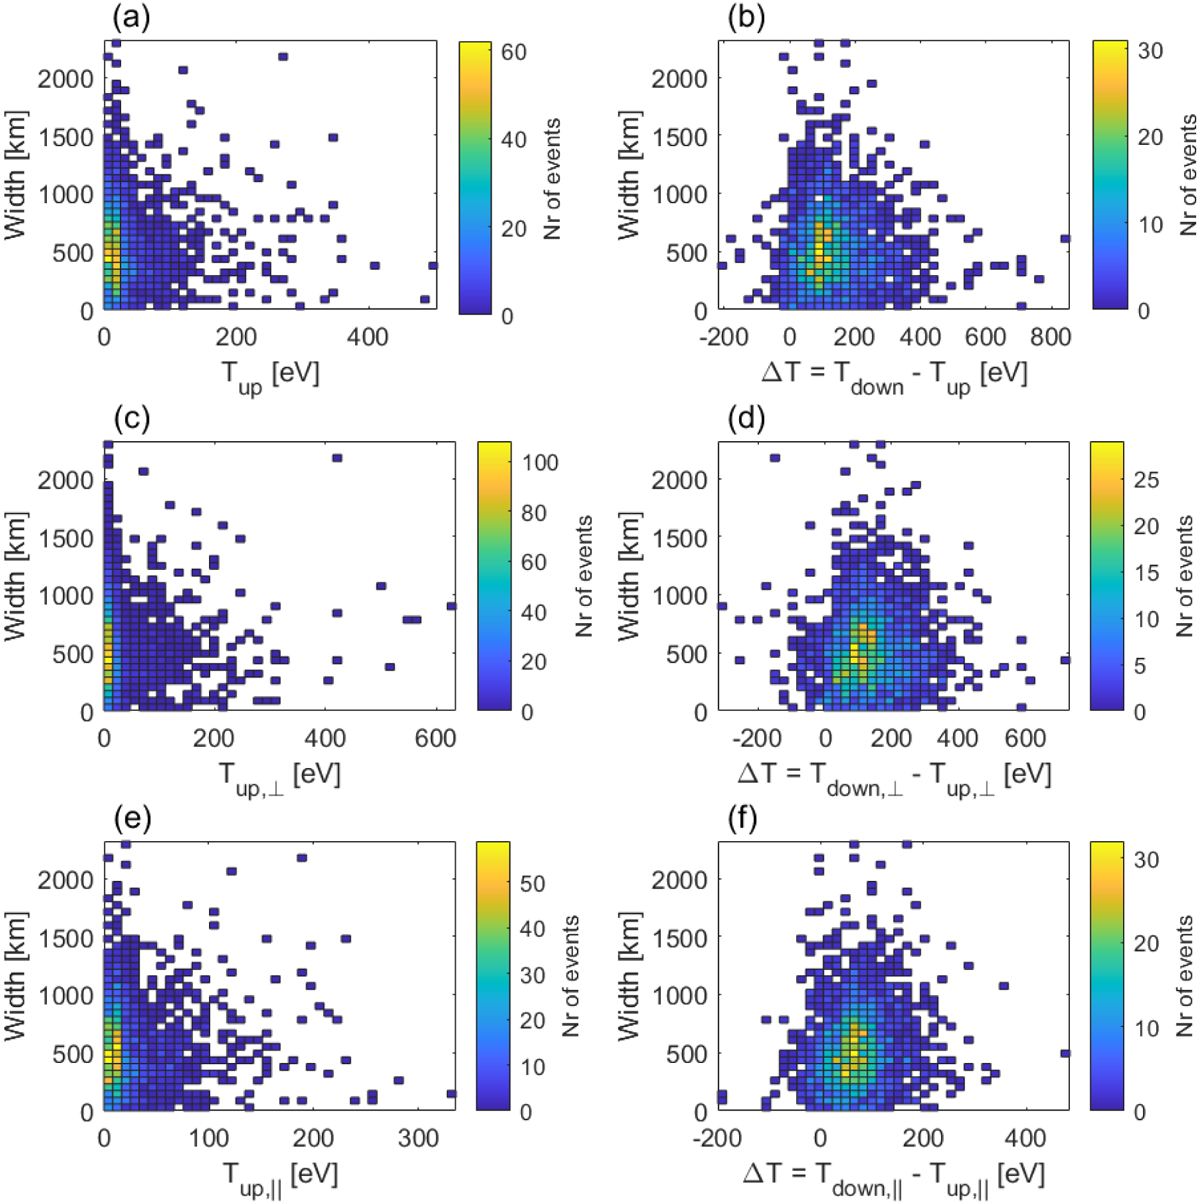
2D histogram of the shock region width over temperature. The color bar signifies the number of events per bin. The left column shows the upstream temperature and the temperature components perpendicular and parallel to the background magnetic field. In the right column, the difference between the downstream and upstream temperatures is shown, also for the total temperature and for the components.
Current usage metrics show cumulative count of Article Views (full-text article views including HTML views, PDF and ePub downloads, according to the available data) and Abstracts Views on Vision4Press platform.
Data correspond to usage on the plateform after 2015. The current usage metrics is available 48-96 hours after online publication and is updated daily on week days.
Initial download of the metrics may take a while.