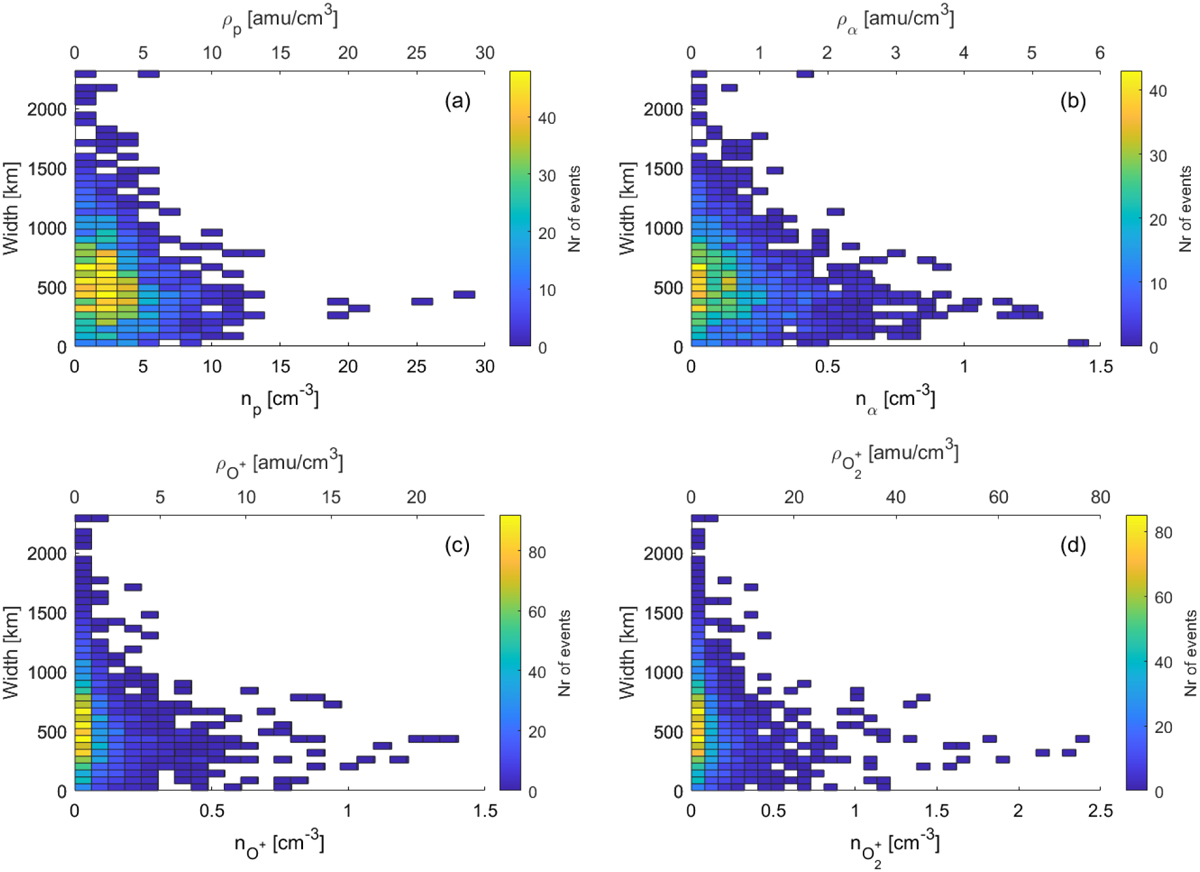
Fig. 4
Download original image
2D histogram of the shock region width over the upstream ion densities. The color bar signifies the number of events per bin. The upper and lower x-axis of the graphs shows the number and mass density, respectively. The panels show the following ion species: (a) protons, (b) alpha particles, (c) oxygen, and (d) molecular oxygen.
Current usage metrics show cumulative count of Article Views (full-text article views including HTML views, PDF and ePub downloads, according to the available data) and Abstracts Views on Vision4Press platform.
Data correspond to usage on the plateform after 2015. The current usage metrics is available 48-96 hours after online publication and is updated daily on week days.
Initial download of the metrics may take a while.