Fig. 1
Download original image
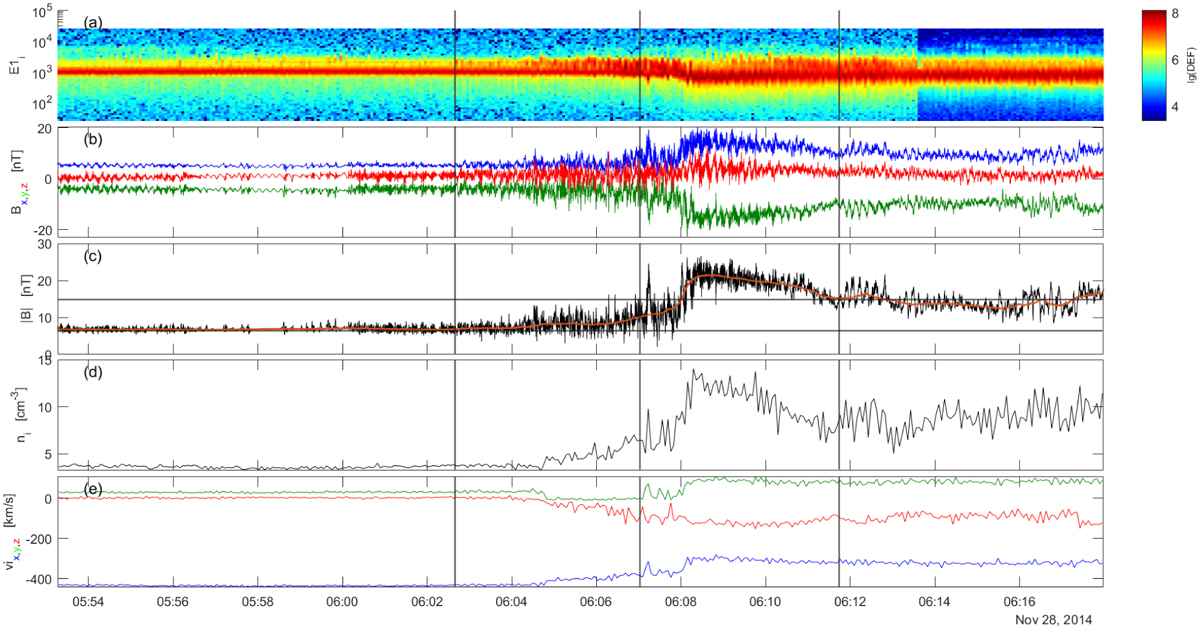
Quasi-perpendicular bow shock region with a width of 623 km. The spacecraft position at the time of the bow shock crossing (06:07:02) was (−0.07, 1.23, −2.59)RM. The panels show (a) the ion-energy spectrogram, (b) the magnetic field components, (c) the magnitude of the magnetic field, in black, and the filtered magnetic field, Bfilt, in red, with the upstream and downstream average being shown by the lower and upper horizontal line, respectively, (d) the ion density, and (e) the velocity components. The leftmost and rightmost vertical lines in the panels signify the start and end of the bow shock region, respectively. The middle vertical line signifies the bow shock crossing, as determined by Fruchtman et al. (2023). All vector quantities are represented in the MSO coordinate system.
Current usage metrics show cumulative count of Article Views (full-text article views including HTML views, PDF and ePub downloads, according to the available data) and Abstracts Views on Vision4Press platform.
Data correspond to usage on the plateform after 2015. The current usage metrics is available 48-96 hours after online publication and is updated daily on week days.
Initial download of the metrics may take a while.