Fig. 2
Download original image
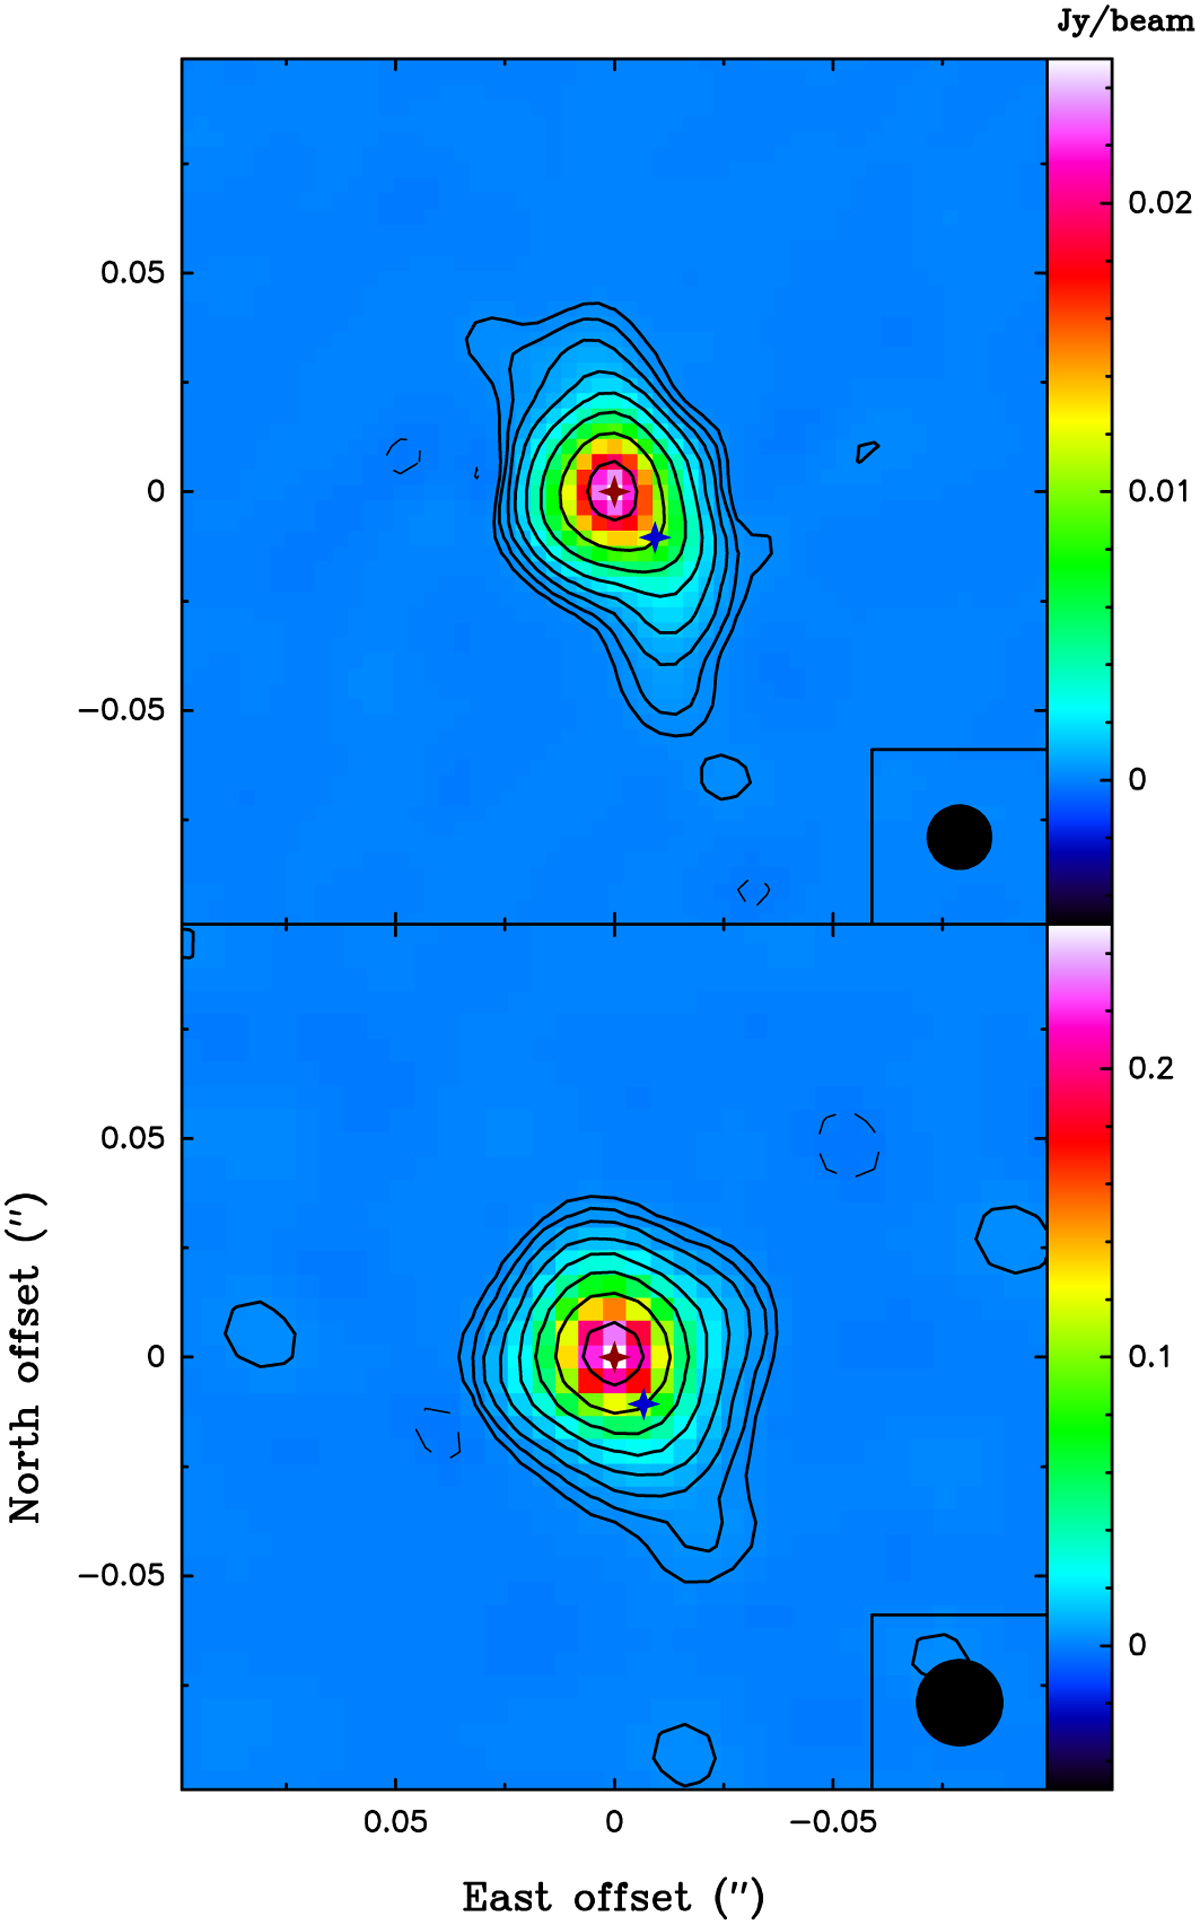
High-resolution continuum maps at 1.3 (top panel) and 0.45 mm (bottom panel) toward R Aqr. The contour level spacing is logarithmic, with a step of a factor of two. The first contours are ±0.15 and ± 1.5 mJy beam−1 for the 1.3 and 0.45 mm maps, respectively. Dashed lines indicate negative levels. The observations are centered at the continuum centroid and taken as the position of the AGB primary (indicated by a red star). The expected position for the secondary is marked by a blue star. The restoring beam shape is displayed in the lower-right corner inset.
Current usage metrics show cumulative count of Article Views (full-text article views including HTML views, PDF and ePub downloads, according to the available data) and Abstracts Views on Vision4Press platform.
Data correspond to usage on the plateform after 2015. The current usage metrics is available 48-96 hours after online publication and is updated daily on week days.
Initial download of the metrics may take a while.