Fig. C.1
Download original image
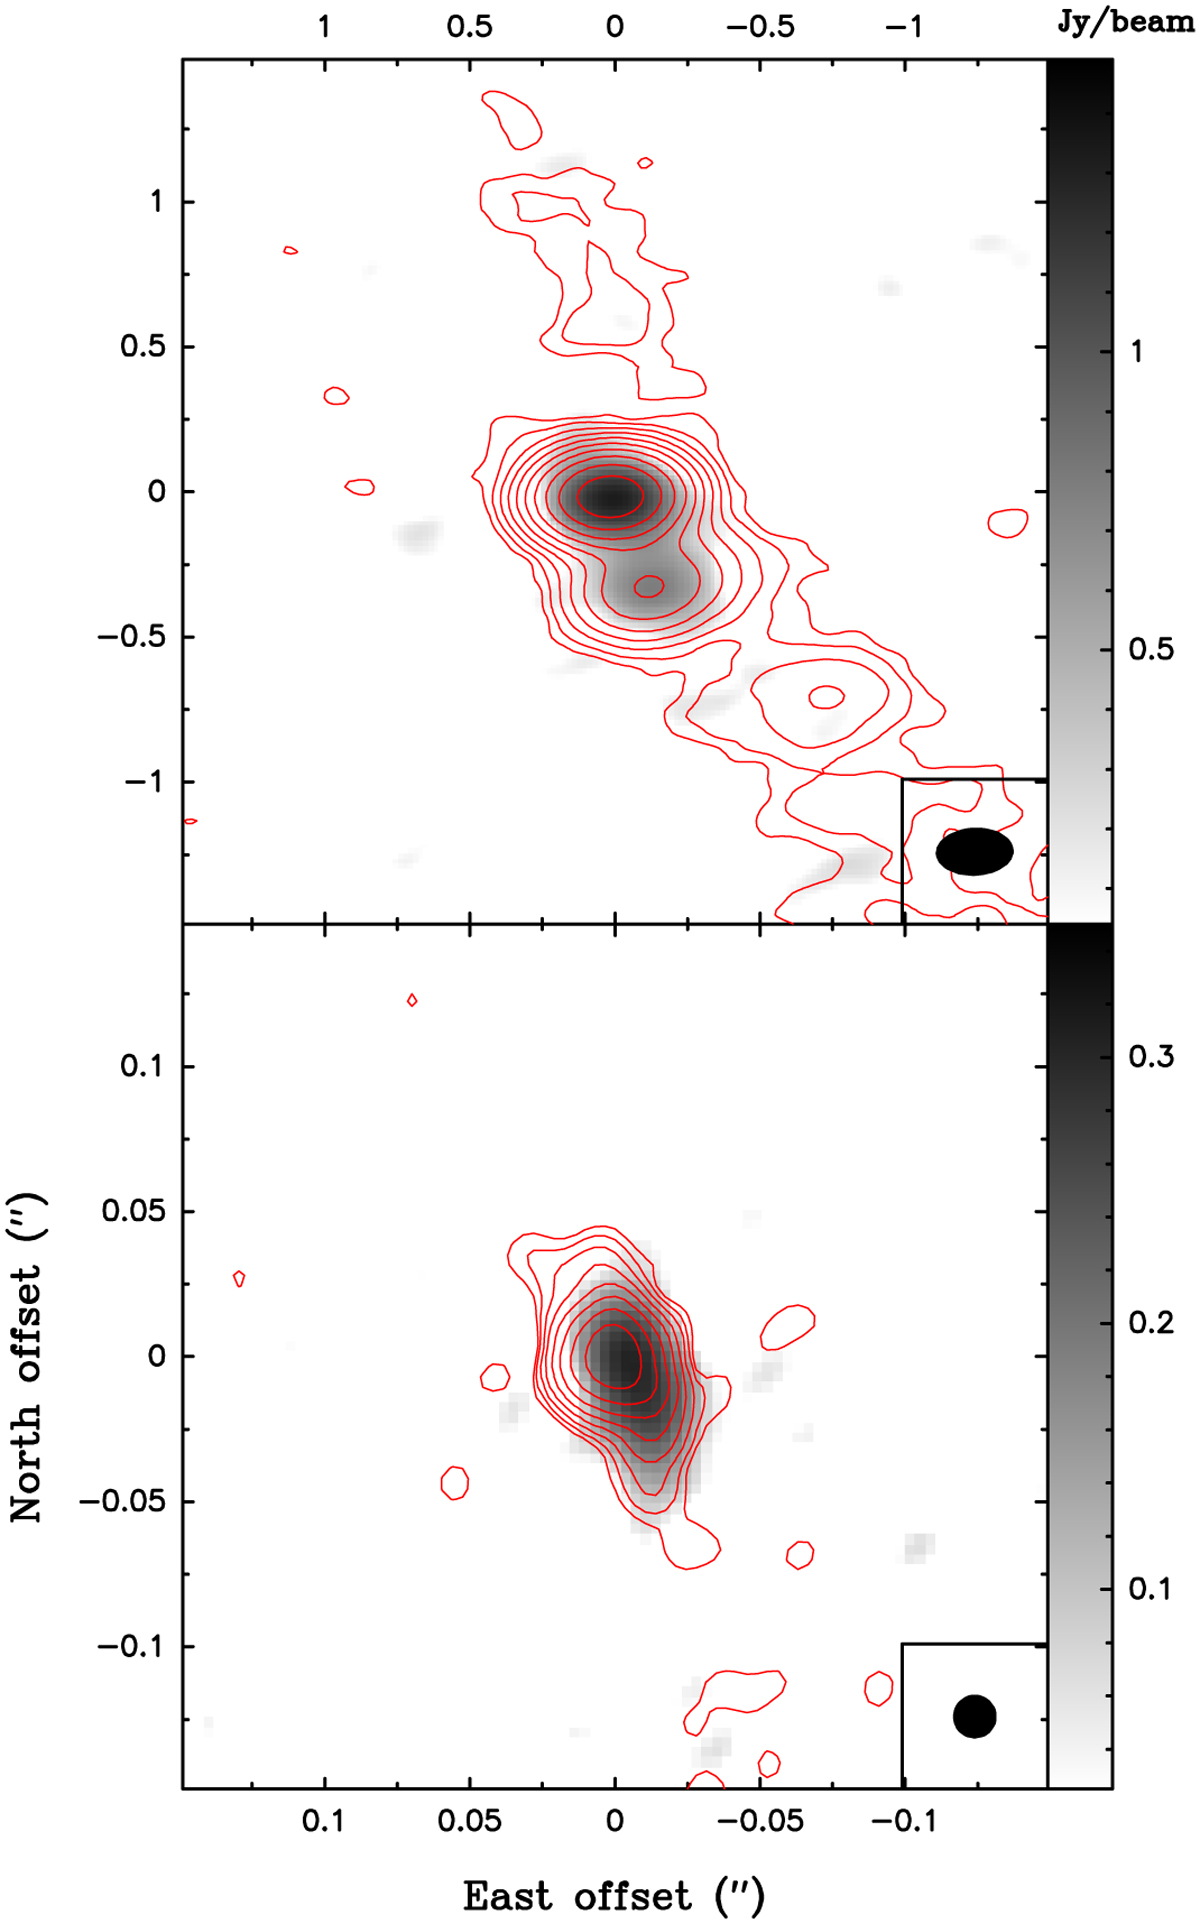
Low-resolution upper panel and high-resolution (bottom panel) maps of continuum (red contours) and H30α (gray scale) observed toward R Aqr. For both low- and high-resolution maps, the contours are logarithmic, with a step of a factor of two and a first level of ±0.07 and ±0.1 mJy beam−1 respectively. The HPBW is shown in the inset. We also note that the area shown in both panels is different.
Current usage metrics show cumulative count of Article Views (full-text article views including HTML views, PDF and ePub downloads, according to the available data) and Abstracts Views on Vision4Press platform.
Data correspond to usage on the plateform after 2015. The current usage metrics is available 48-96 hours after online publication and is updated daily on week days.
Initial download of the metrics may take a while.