Fig. 1
Download original image
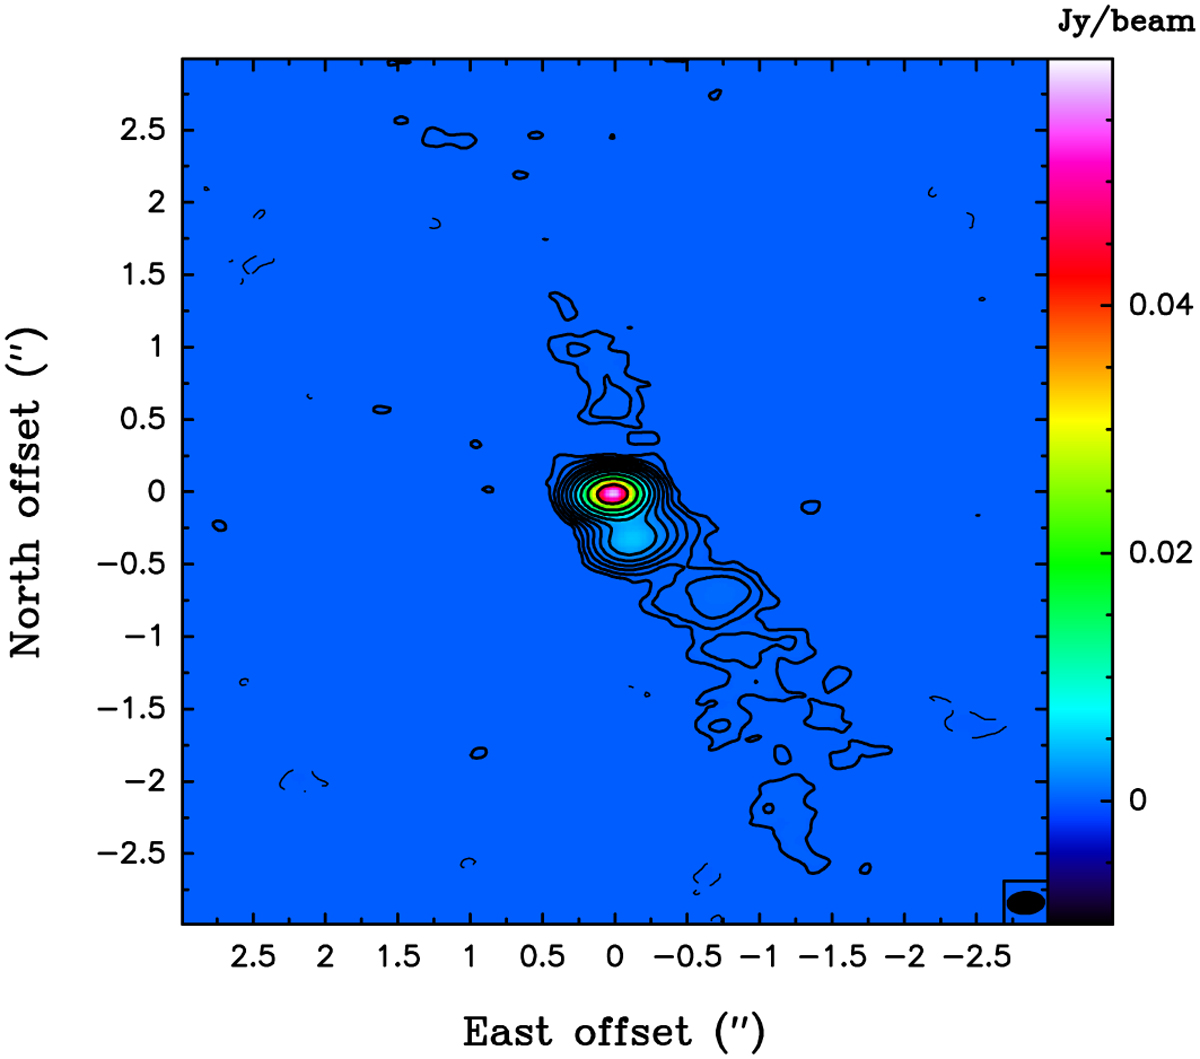
Low-resolution 1.3 mm continuum map toward R Aqr. The contour level spacing is logarithmic with a jump of a factor of two. The first contour is ±0.07 mJy beam−1. Dashed lines indicate negative levels. The image is centered on the continuum centroid. The beam, with a size of 264 × 163 mas and PA of 95 AA, is shown in the lower-right corner inset.
Current usage metrics show cumulative count of Article Views (full-text article views including HTML views, PDF and ePub downloads, according to the available data) and Abstracts Views on Vision4Press platform.
Data correspond to usage on the plateform after 2015. The current usage metrics is available 48-96 hours after online publication and is updated daily on week days.
Initial download of the metrics may take a while.