Fig. 8.
Download original image
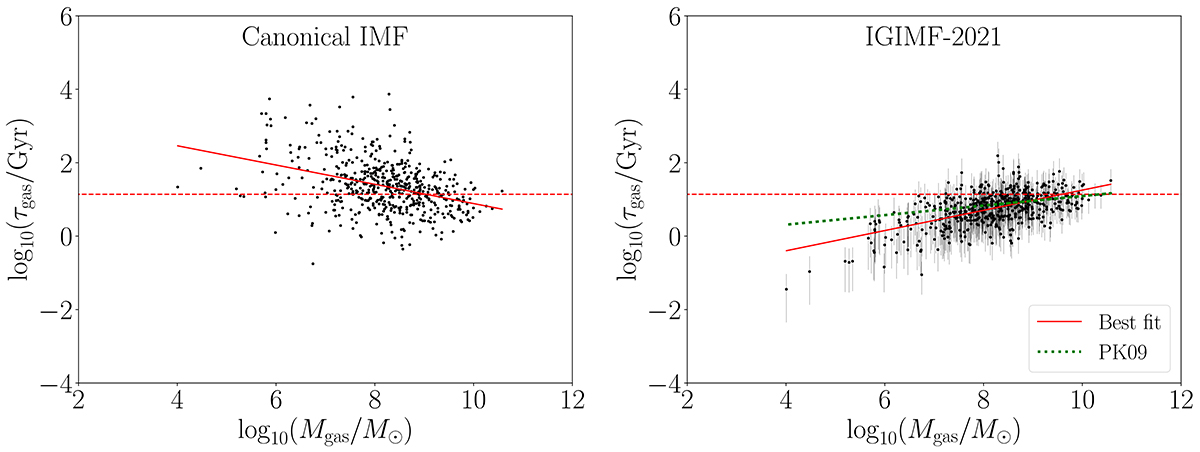
Gas depletion timescale, τgas, in dependence of the gas mass assuming the gwIMF in the invariant canonical IMF (left panel) and IGIMF-2021 (right panel) for galaxies located in the LV. The dashed red line shows the age of the Universe, τgas = τh = 13.8 Gyr, assuming the standard ΛCDM cosmology (Planck Collaboration XIII 2016). The error on the IGIMF-corrected τgas values (right panel) is estimated by adopting the SFR values for [Z] = −2.20 (upper limit) and [Z] = 0.45 (lower limit; Sect. 4.2). The solid red lines are fits of the data with Eq. (20). The green dotted line is the ‘minimum-1’ model of Pflamm-Altenburg & Kroupa (2009, their Fig. 7). Note the smaller scatter of the data in the right panel (see also Fig. 9).
Current usage metrics show cumulative count of Article Views (full-text article views including HTML views, PDF and ePub downloads, according to the available data) and Abstracts Views on Vision4Press platform.
Data correspond to usage on the plateform after 2015. The current usage metrics is available 48-96 hours after online publication and is updated daily on week days.
Initial download of the metrics may take a while.