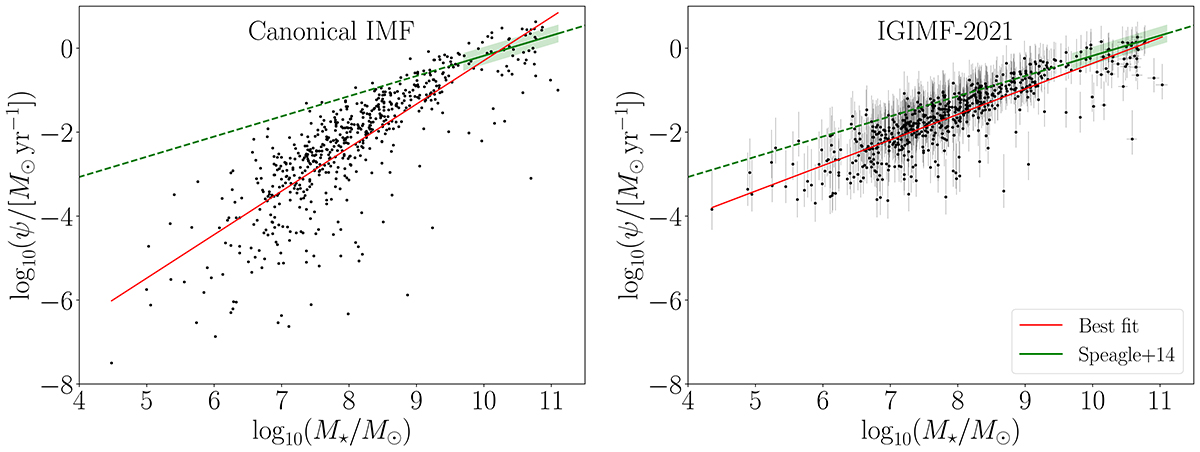
Fig. 7.
Download original image
Star formation rate derived from the Hα luminosity in dependence of the stellar mass derived from the K-band luminosity (Karachentsev et al. 2013) assuming an invariant canonical gwIMF (left panels) and the IGIMF-2021 (right panels) for galaxies located in the LV. The errorbars of the IGIMF-corrected stellar mass values refer to the two different applied chemical enrichment models (Sect. 4.2) and the errorbars of the IGIMF-corrected SFR values refer to metallicities of [Z] = −2.20 (lower limit) and [Z] = 0.45 (upper limit; see Sect. 4.2). The SFR values have an uncertainty of about 30% due to distance uncertainties (see Fig. 1 of Kroupa et al. 2020a; Karachentsev et al. 2004, 2013). The solid green lines show the present-day main sequence of star-forming galaxies with 109.7 < M⋆/M⊙ < 1011.1 and a scatter of ±0.2 dex highlighted by the shaded area (i.e. Eq. (28) of Speagle et al. 2014, and Eq. (17)). The dashed green lines are extrapolations beyond the adopted fitted range of the stellar masses. The solid red lines show the linear best fit to the corresponding data (Eq. (18) for the right panel). Note the smaller scatter in the right panel.
Current usage metrics show cumulative count of Article Views (full-text article views including HTML views, PDF and ePub downloads, according to the available data) and Abstracts Views on Vision4Press platform.
Data correspond to usage on the plateform after 2015. The current usage metrics is available 48-96 hours after online publication and is updated daily on week days.
Initial download of the metrics may take a while.