Fig. 10.
Download original image
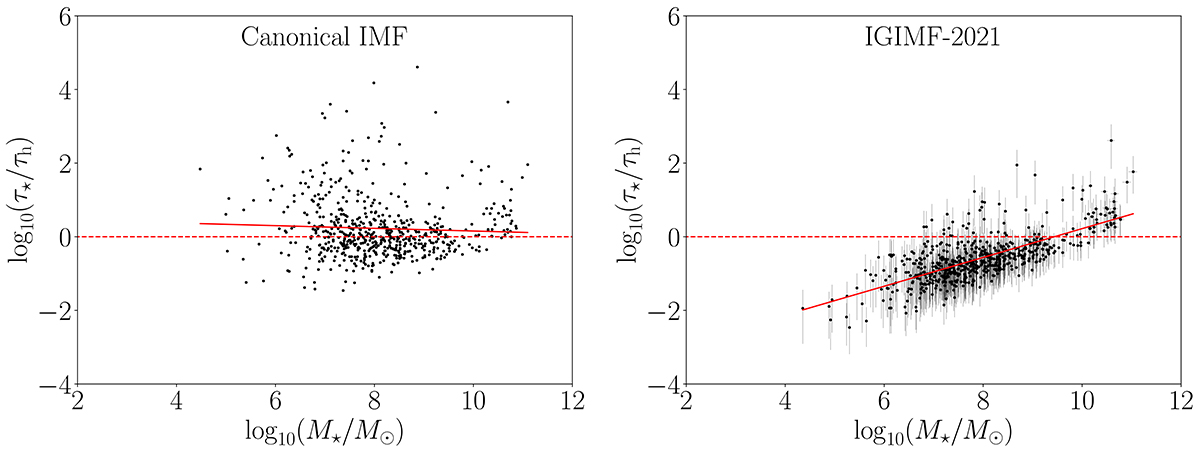
Characteristic stellar mass buildup timescale normalized by the age of the Universe of τh = 13.8 Gyr (Planck Collaboration XIII 2016) in dependence of the stellar mass in the invariant canonical IMF (left panel) and the IGIMF-2021 (right panel) context for galaxies located in the LV. The dashed red line refers to a characteristic stellar mass buildup timescale equal to τh = 13.8 Gyr. In the right panel, the uncertainty of the IGIMF effect is plotted while the measurement errors are not shown. The upper and lower limits of the IGIMF-corrected τ⋆ values (right panel) are estimated by adopting τup, ⋆ = Mupper, ⋆/ψ([Z] = −2.20) and τlow, ⋆ = Mlow, ⋆/ψ([Z] = 0.45), respectively. ψ([Z] = −2.20) and ψ([Z] = 0.45) refer to the IGIMF-corrected SFR values for [Z] = −2.20 and [Z] = 0.45 (Sect. 4.2). Mup, ⋆ and Mlow, ⋆ refer to the upper and lower IGIMF-corrected stellar masses by applying the maximum and minimum M⋆/LK values (Sect. 4.2). The solid red lines are fits of the data with Eq. (23).
Current usage metrics show cumulative count of Article Views (full-text article views including HTML views, PDF and ePub downloads, according to the available data) and Abstracts Views on Vision4Press platform.
Data correspond to usage on the plateform after 2015. The current usage metrics is available 48-96 hours after online publication and is updated daily on week days.
Initial download of the metrics may take a while.