Fig. 4.
Download original image
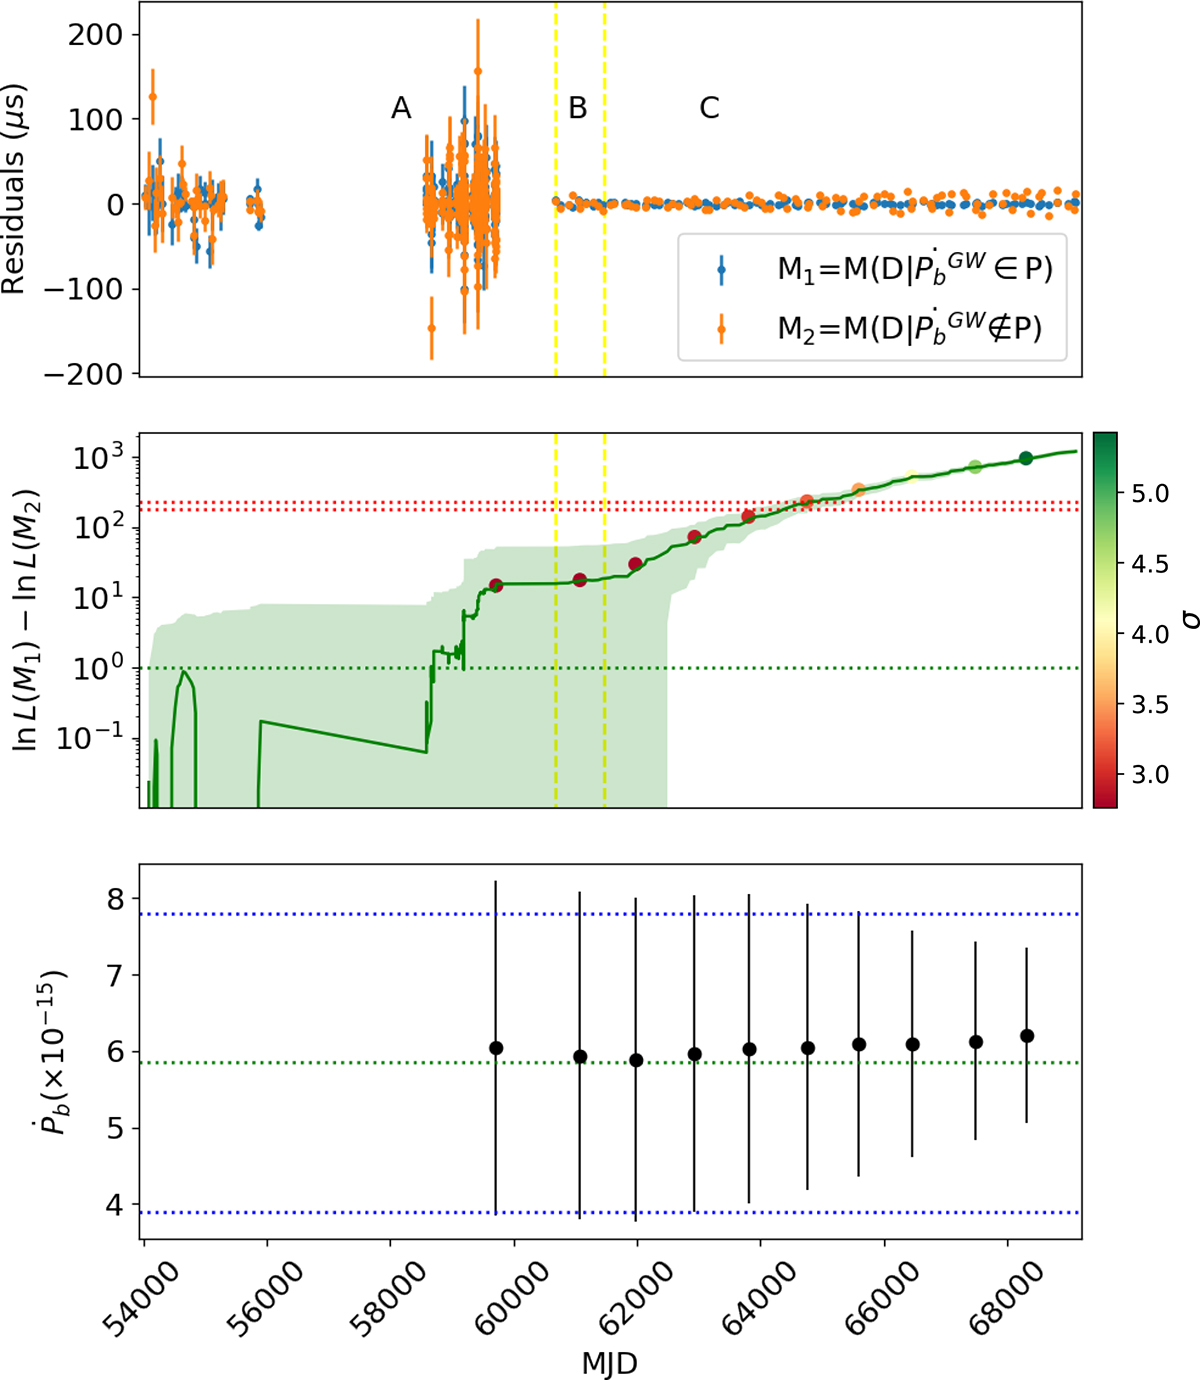
Timing residuals of the simulated datasets, with, and without Ṗb, which are Model 1 (blue) and Model 2 (orange), respectively, shown in the top panel. The middle panel illustrates the difference in the log-likelihood between two models with respect to the time in a MJD scale. The red-dotted lines indicate the significance of detection (≥3σ), either from fitting and from lnL. The color bar scale indicates the significance of the fitting of Ṗb. The detection is expected to be around 64 000–65 000 MJD. The lower panel indicates the expected measurements on Ṗ effect over time. The expected value and the 3σ uncertainty range of Ṗb are depicted with green and blue dotted lines, separately.
Current usage metrics show cumulative count of Article Views (full-text article views including HTML views, PDF and ePub downloads, according to the available data) and Abstracts Views on Vision4Press platform.
Data correspond to usage on the plateform after 2015. The current usage metrics is available 48-96 hours after online publication and is updated daily on week days.
Initial download of the metrics may take a while.