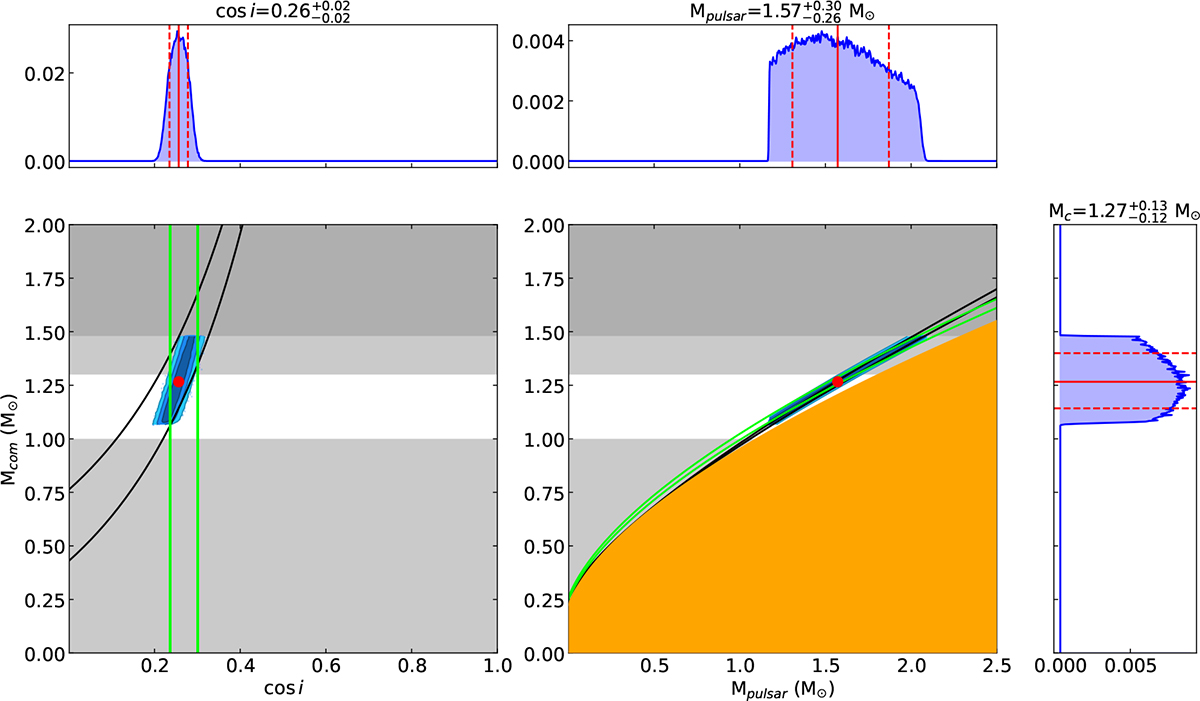
Fig. 3.
Download original image
Mass–mass diagram and the marginalised histograms. The black and green solid lines indicate 1σ range of h3 and ς, respectively. The companion mass, the inclination angle as well as the pulsar mass were determined based on the probability density distribution (PDF). The measured values (solid red lines), and uncertainties (dashed red lines) are determined from the median, and 68.1% confidence intervals, respectively. However, the error scale of the pulsar mass is large because of the shallow angle between the h3 and ς curves. The red point indicates the peak position of the posterior distributions of the measured masses from TEMPONEST. The parts of a tail, exceeding the Chandrasekhar mass (Mch = 1.48 M⊙) which is shown as a dark grey, were truncated. We also excluded the PDFs below the minimum neutron star mass, Mpulsar, min = 1.17 M⊙, determined by Suwa et al. (2018). The light grey is the outside of the range of the expected companion mass by PA13.
Current usage metrics show cumulative count of Article Views (full-text article views including HTML views, PDF and ePub downloads, according to the available data) and Abstracts Views on Vision4Press platform.
Data correspond to usage on the plateform after 2015. The current usage metrics is available 48-96 hours after online publication and is updated daily on week days.
Initial download of the metrics may take a while.