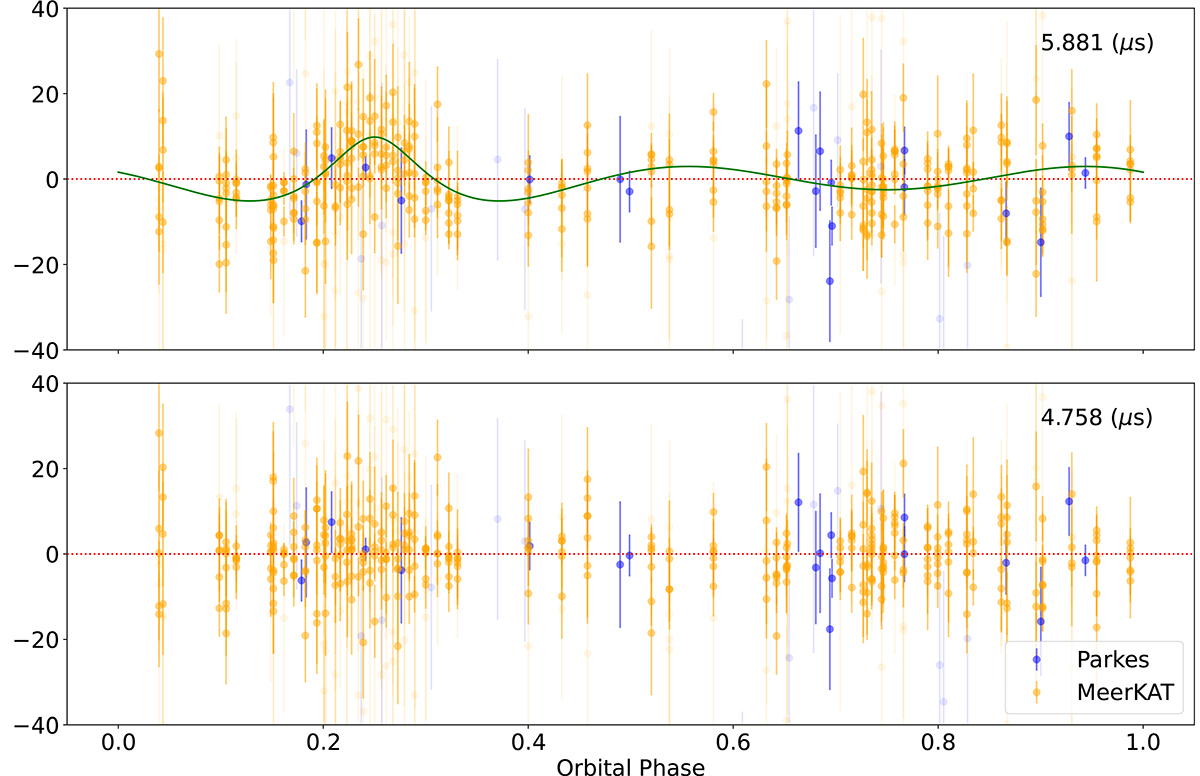
Fig. 2.
Download original image
Noise-free residuals in terms of the orbital phase. The level of uncertainties above 15 μs are dimmed in order to describe the trend clearly. The RMS levels are displayed in the upper right corner of each plot. Top: post-fit residuals with fixed h3 = 0, and η = 1. Notice that some of the Shapiro delay signature is absorbed by Keplerian orbital parameters. However, the Shapiro delay is still prominent. Lower: Post-fit residuals with the best-fit parameters in Table 3. Timing jumps have been applied to each receiver to account for any time offset. The size of the error-bars have been scaled with the corresponding EFAC and EQUAD.
Current usage metrics show cumulative count of Article Views (full-text article views including HTML views, PDF and ePub downloads, according to the available data) and Abstracts Views on Vision4Press platform.
Data correspond to usage on the plateform after 2015. The current usage metrics is available 48-96 hours after online publication and is updated daily on week days.
Initial download of the metrics may take a while.