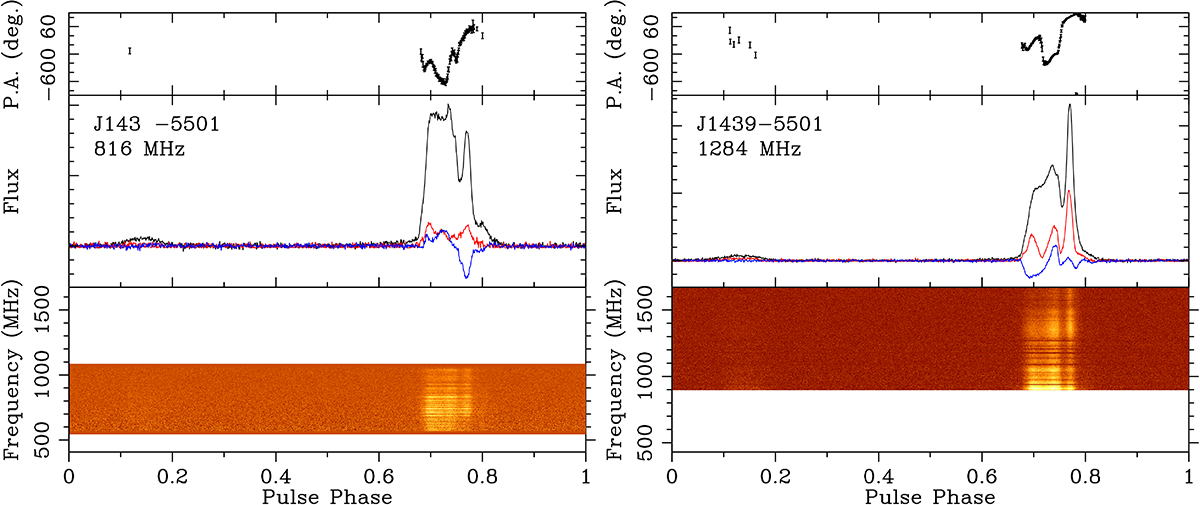
Fig. 1.
Download original image
Observed profiles and its variations in each sub-band of the MeerKAT dataset, after applying the Faraday rotation correction based on the obtained RMs in Table 2. The right panel refers to the L band and the left to the UHF band. In both panels, the black, red, and blue lines are the total intensity, linear, and circular polarization, respectively.
Current usage metrics show cumulative count of Article Views (full-text article views including HTML views, PDF and ePub downloads, according to the available data) and Abstracts Views on Vision4Press platform.
Data correspond to usage on the plateform after 2015. The current usage metrics is available 48-96 hours after online publication and is updated daily on week days.
Initial download of the metrics may take a while.