Fig. 6.
Download original image
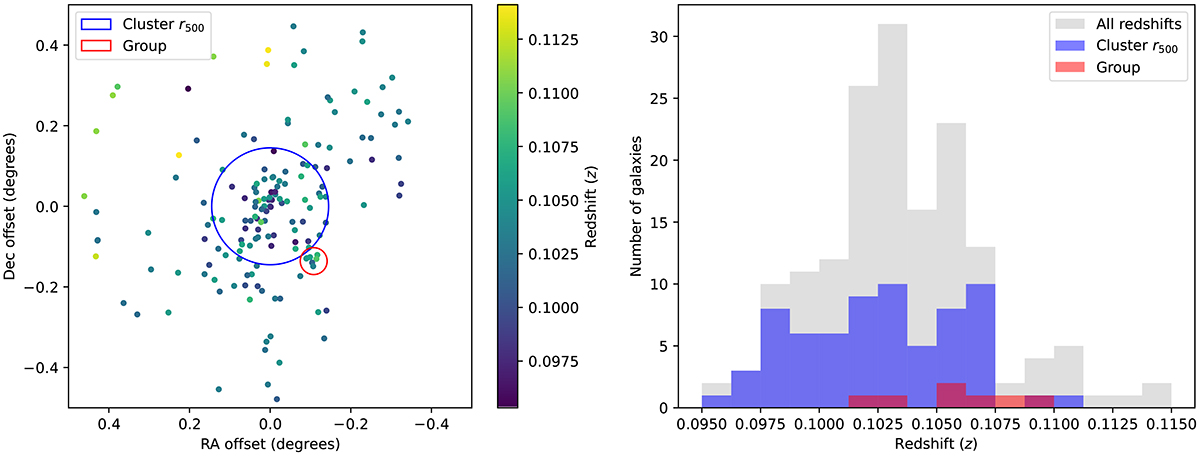
Distribution of the redshifts of the cluster and the nearby galaxies. Left: Sky distribution of galaxies in the cluster Abell 7 with 0.095 < z < 0.115. The large blue circle shows the r500 for the cluster as described in the text, and the small red circle indicates a 2 arcmin (∼250 kpc) radius around the host of J0011+3217. Note that a bright star at the bottom right of the plot may prevent the detection of galaxies in this area. Right: Histogram of the redshifts in the left panel, with galaxies within r500 highlighted in blue and those close to the radio source in red. If some or all of the galaxies close to the radio source form a group, the group has a systematic velocity offset with respect to the cluster.
Current usage metrics show cumulative count of Article Views (full-text article views including HTML views, PDF and ePub downloads, according to the available data) and Abstracts Views on Vision4Press platform.
Data correspond to usage on the plateform after 2015. The current usage metrics is available 48-96 hours after online publication and is updated daily on week days.
Initial download of the metrics may take a while.