Fig. 5.
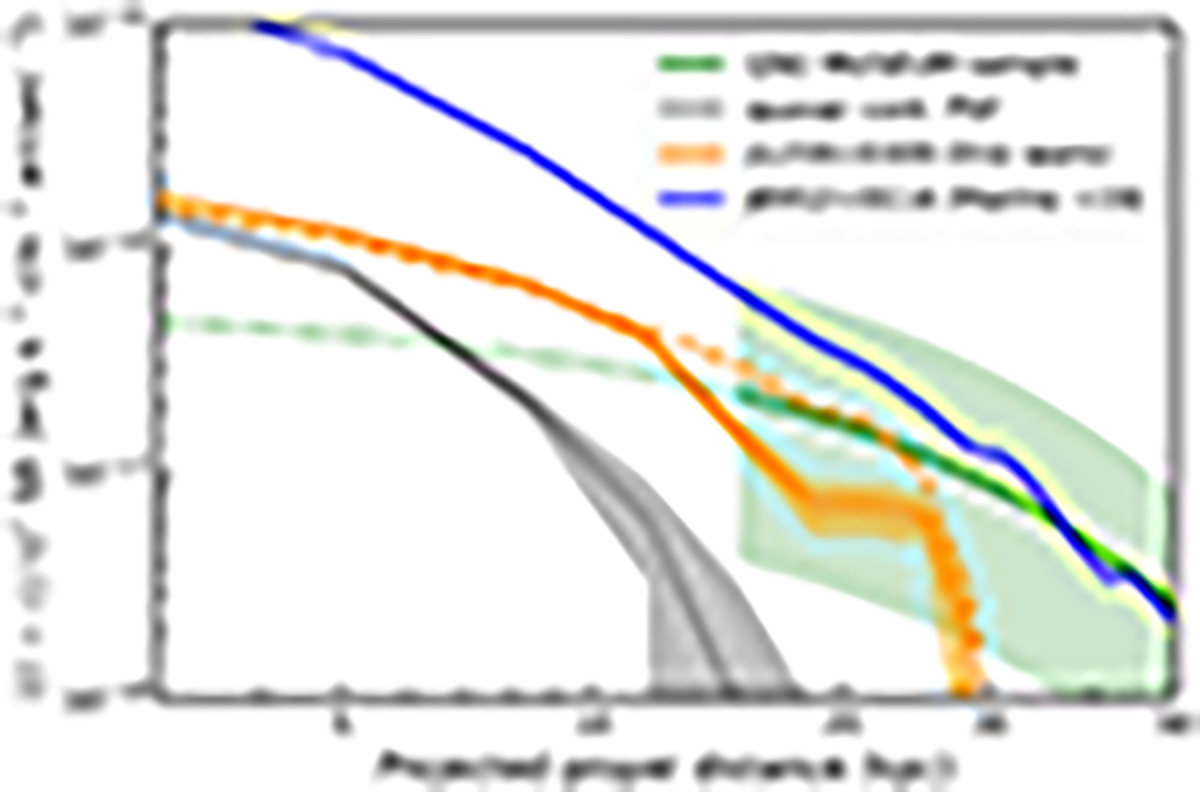
Download original image
Circularly average Lyα SB profiles (corrected for redshift dimming) as a function of projected distance from the central quasar. Solid orange, blue, and green lines stand for J1259+0309 (this work, with the 1σ error shown as the shaded area), J0952+0114 (Marino et al. 2019), and the average of the QSO MUSEUM sample (Arrigoni Battaia et al. 2019, with 1σ scatter as the light green area), respectively. The dotted green line is an extrapolation of the QSO MUSUEM sample toward low radii. The dashed orange line shows the eastward average profile for J1259+0309 (see Sect. 4). The sharp drop at 30 kpc in the J1259+0309 profile is due to sensitivity limitations. The PSF shape, derived from the quasar continuum, is shown as a solid grey line (with 1σ error) and is scaled for visual purposes.
Current usage metrics show cumulative count of Article Views (full-text article views including HTML views, PDF and ePub downloads, according to the available data) and Abstracts Views on Vision4Press platform.
Data correspond to usage on the plateform after 2015. The current usage metrics is available 48-96 hours after online publication and is updated daily on week days.
Initial download of the metrics may take a while.