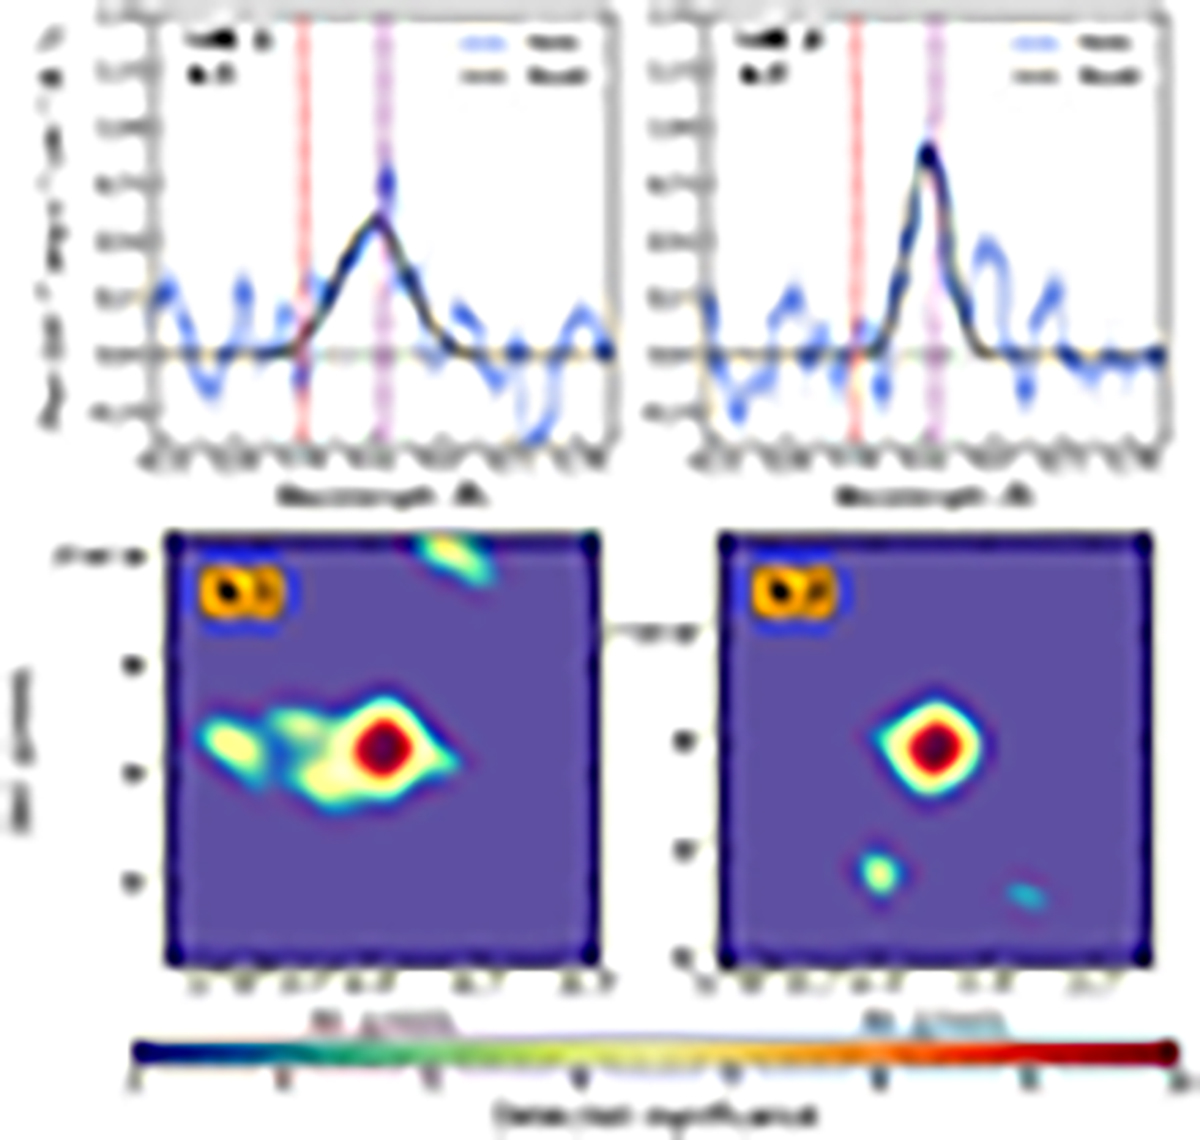
Fig. 4.
Download original image
LSDCat LAE candidates. (a.1, a.2): LAE candidate spectra obtained obtained using 1″ apertures centered at the coordinates reported in Table 1. Dashed red and purple lines show the expected wavelength of the emission at the quasar systemic and PDLA redshift. The solid black line shows a Gaussian model fitted to the data. Propagated 1σ errors are shown as vertical blue lines. (b.1, b.2): LSDCat output detection significance maps at the wavelength channel where the peak of Lyα emission is reached.
Current usage metrics show cumulative count of Article Views (full-text article views including HTML views, PDF and ePub downloads, according to the available data) and Abstracts Views on Vision4Press platform.
Data correspond to usage on the plateform after 2015. The current usage metrics is available 48-96 hours after online publication and is updated daily on week days.
Initial download of the metrics may take a while.