Fig. 3.
Download original image
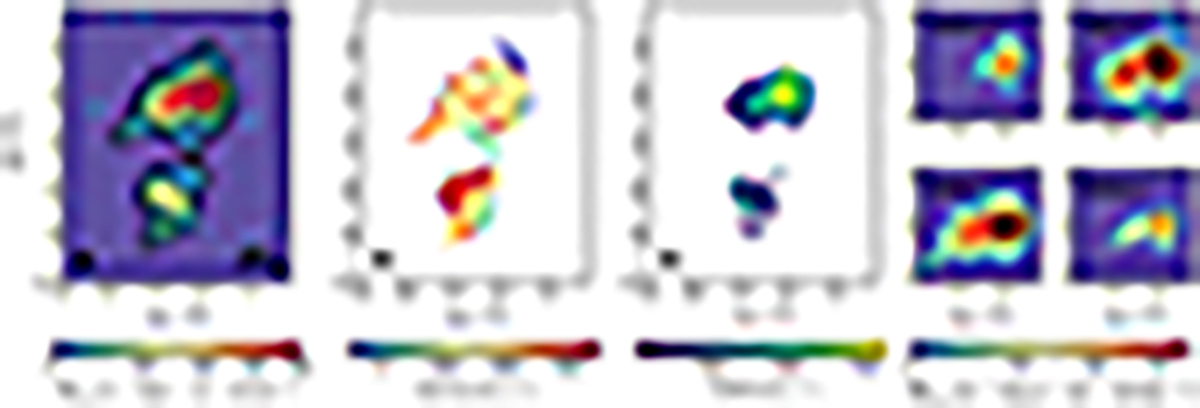
Lyα nebula around J1259+0309. First panel: Optimally extracted Lyα nebula (zeroth moment) from continuum-subtracted MUSE data cube. The spatial projection of the segmentation mask is shown as a thick black contour around the detected emission, and it is approximately a 2.5σ = 2.45 × 10⁻¹⁸ erg s−1 cm−2 arcsec−2 contour. Thin black contours enclose 5, 10 and 15σ regions. The black horizontal line indicates a scale of 10 pkpc. For reference, the PSF is depicted by a black circle with a diameter of 0.7″. Second panel: Velocity map of the emission with the zero point defined by zsys. Third panel: Second moment map to show the equivalent Gaussian FWHM, where the instrumental FWHMins ≈ 170 km s−1 has been subtracted in quadrature. Each image has a linear projected size of 14″ × 17″ and coordinates are relative to the quasar position. Last panel: Zoomed-in views of the inner region of the emission in four ≈290 km s−1 wide velocity bins. The central value is indicated in the top-left corner of each image. Isophotal contours of SB values of 15, 30, and 45 × 10−18 erg s−1 cm−2 arcsec−2 are shown.
Current usage metrics show cumulative count of Article Views (full-text article views including HTML views, PDF and ePub downloads, according to the available data) and Abstracts Views on Vision4Press platform.
Data correspond to usage on the plateform after 2015. The current usage metrics is available 48-96 hours after online publication and is updated daily on week days.
Initial download of the metrics may take a while.