Fig. 1.
Download original image
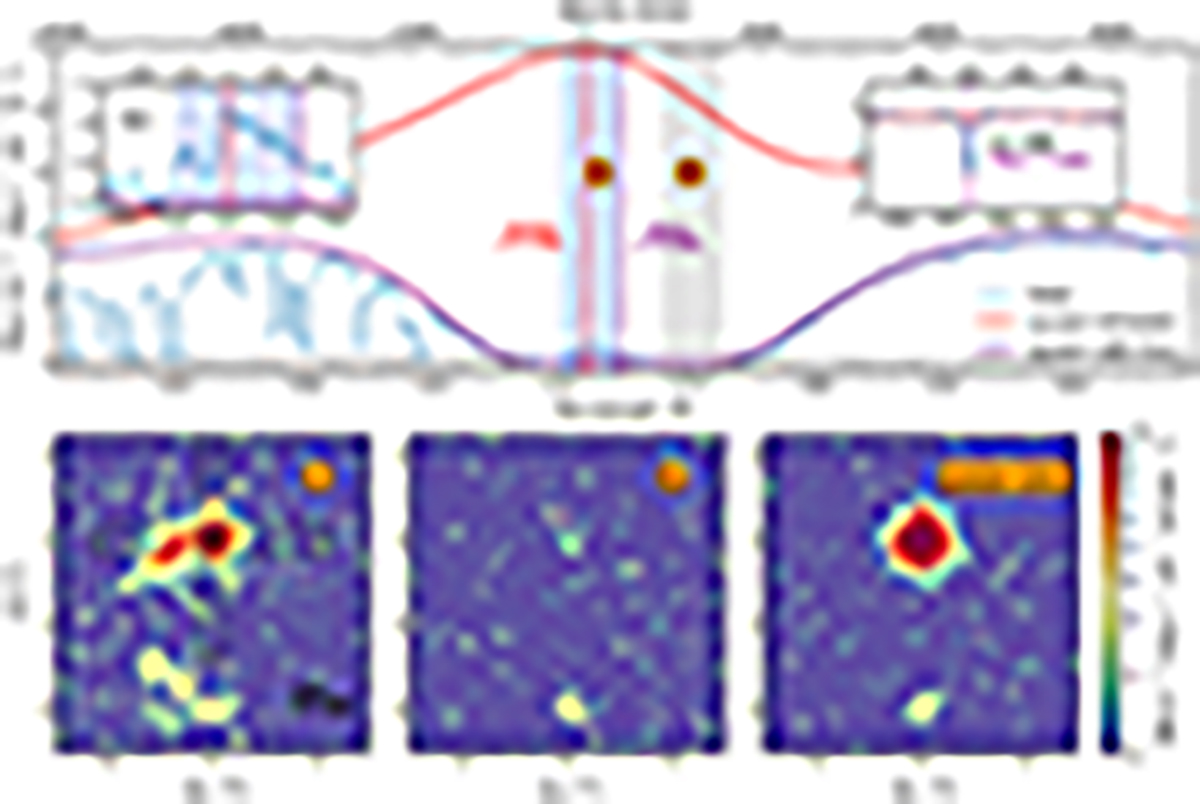
J1259+0309 spectrum and MUSE narrow band images around the DLA core. Top row: J1259+0309 X-shooter 1D combined spectrum around systemic the Lyα wavelength. The solid red line shows the reconstructed quasar emission, to which the PDLA Voigt profile model (log N(H/I) ≈ 21.4) is then applied to obtain the solid purple line. Vertical dashed red and purple lines indicate the expected location of lines at the quasar systemic redshift from CO(3−2) emission (also the zero point in the velocity from the top axis) and the PDLA, respectively. The inner subpanels present a zoomed-in view in around wavelength regions containing the Lyα emission in the PDLA core and a low-ionization absorption line. Bottom row: MUSE narrowband images from the wavelength regions A and B indicated in the top panel by the vertical blue and gray stripes, respectively. The third panel shows a quasar-continuum-only region at 5400−5412 Å. All images were smoothed using a Gaussian kernel, and have the same scale, and coordinates are relative to the quasar central position in the sky. In panel A, horizontal dashed rectangles illustrate the position the two X-shooter slits employed to obtain the combined 1D spectrum. A scale of 10 proper kpc (≈1.3″) is shown as a horizontal solid black line.
Current usage metrics show cumulative count of Article Views (full-text article views including HTML views, PDF and ePub downloads, according to the available data) and Abstracts Views on Vision4Press platform.
Data correspond to usage on the plateform after 2015. The current usage metrics is available 48-96 hours after online publication and is updated daily on week days.
Initial download of the metrics may take a while.