Open Access
Fig. 3.
Download original image
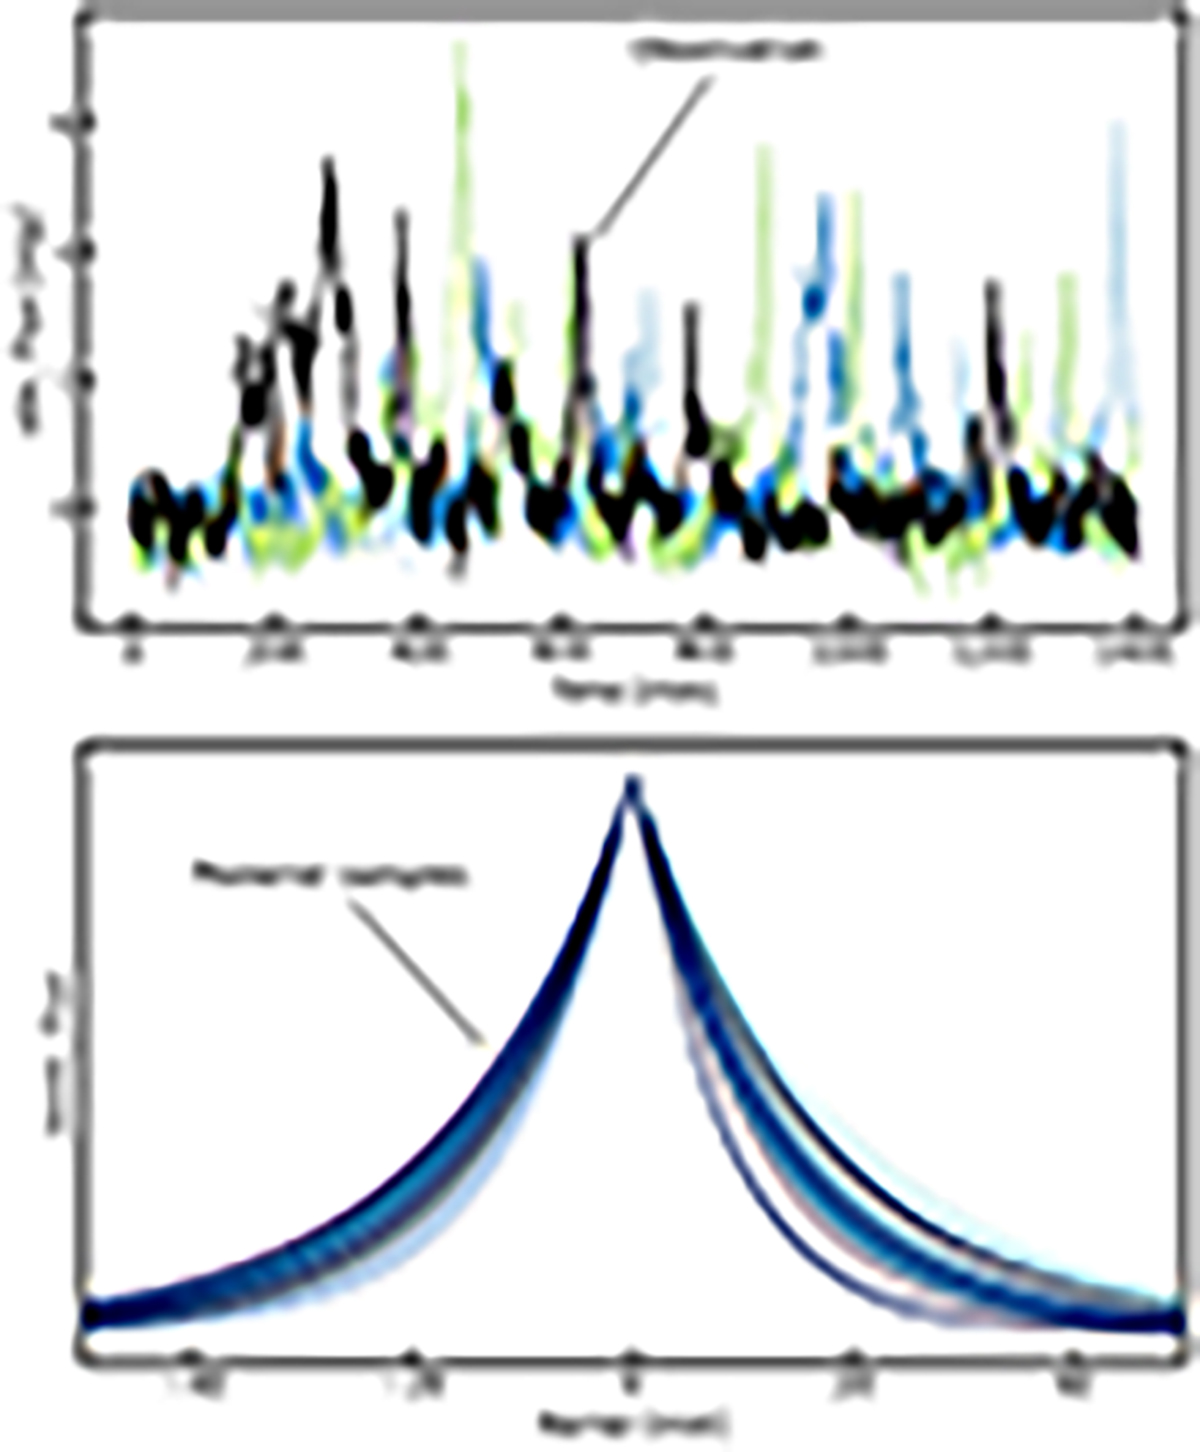
Top: one real and three mock light curves. The colored lines show mock light curves generated with the MA model and best-fit posteriors. The black line shows a segment of an observed Sgr A* light curve. Bottom: Kernel functions constructed using τ1, 2 drawn from the MA-model posterior.
Current usage metrics show cumulative count of Article Views (full-text article views including HTML views, PDF and ePub downloads, according to the available data) and Abstracts Views on Vision4Press platform.
Data correspond to usage on the plateform after 2015. The current usage metrics is available 48-96 hours after online publication and is updated daily on week days.
Initial download of the metrics may take a while.