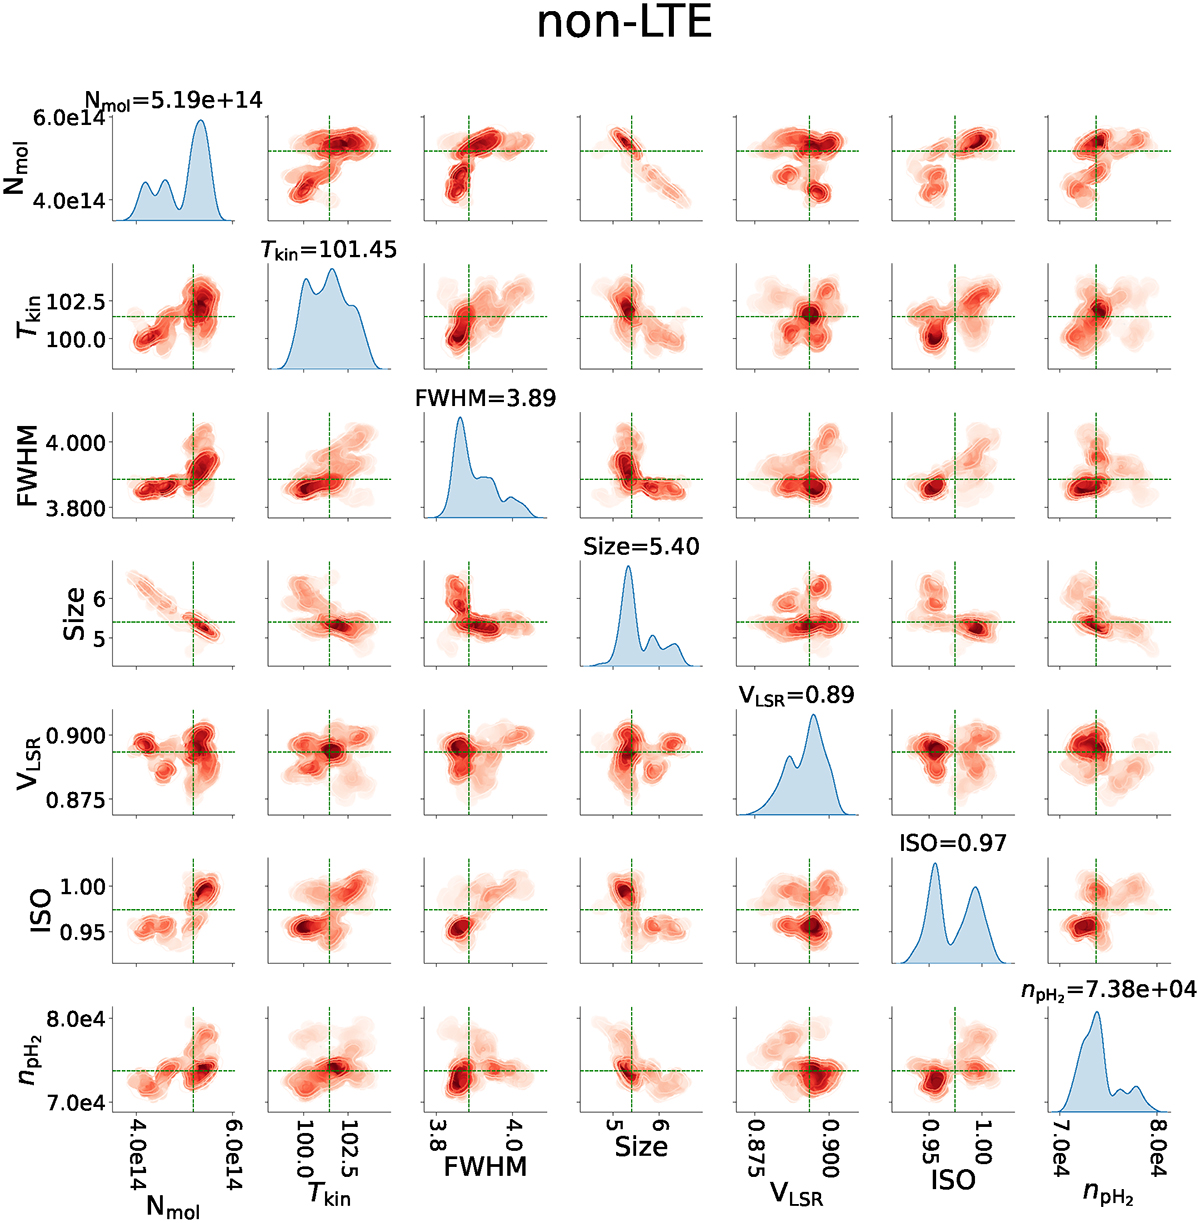
Fig. C.2.
Download original image
Corner plots of the derived free MCMC parameters after 4151 iterations, only contiguous iterations with an acceptance rate in the 0.25–0.5 range are shown. This model was used to create the non-LTE best fit for CARMA-7 inside CASSIS. Median values are labeled above each Gaussian distribution and also marked by green dashed lines inside each subplot.
Current usage metrics show cumulative count of Article Views (full-text article views including HTML views, PDF and ePub downloads, according to the available data) and Abstracts Views on Vision4Press platform.
Data correspond to usage on the plateform after 2015. The current usage metrics is available 48-96 hours after online publication and is updated daily on week days.
Initial download of the metrics may take a while.