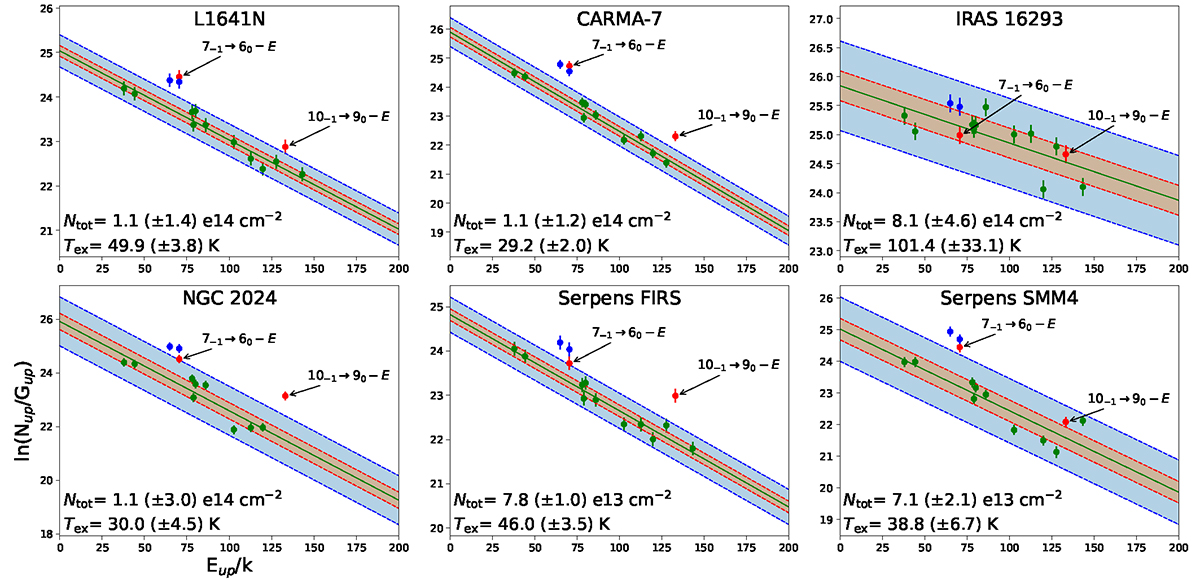
Fig. B.1.
Download original image
Rotation diagrams for sources with detected 7−1 → 60 − E methanol transition (indicated with an arrow). The shaded red and blue regions represent the uncertainty level at 1 and 3σ, respectively. Methanol lines in the J−1 → (J− 1)0 − E line series, prone to be masers, are in red, thermal lines are in green, and quasi-thermal emission (those out of LTE best fit, positive optical depths and strong presence of a non-LTE component in our models) are in blue. These quasi-thermal transitions correspond to the 7−1→6−1 − E and 70→60 − A+ transition lines at 338.344588 and 338.408698 GHz, respectively. Only unblended lines were used for the fit. Best fit results (total column densities (Ntot) and excitation temperatures (Tex) plus 1σ uncertainties) are labeled in the bottom left corner of each subplot. Transitions detected in each source are listed in Table B.1.
Current usage metrics show cumulative count of Article Views (full-text article views including HTML views, PDF and ePub downloads, according to the available data) and Abstracts Views on Vision4Press platform.
Data correspond to usage on the plateform after 2015. The current usage metrics is available 48-96 hours after online publication and is updated daily on week days.
Initial download of the metrics may take a while.