Fig. 2.
Download original image
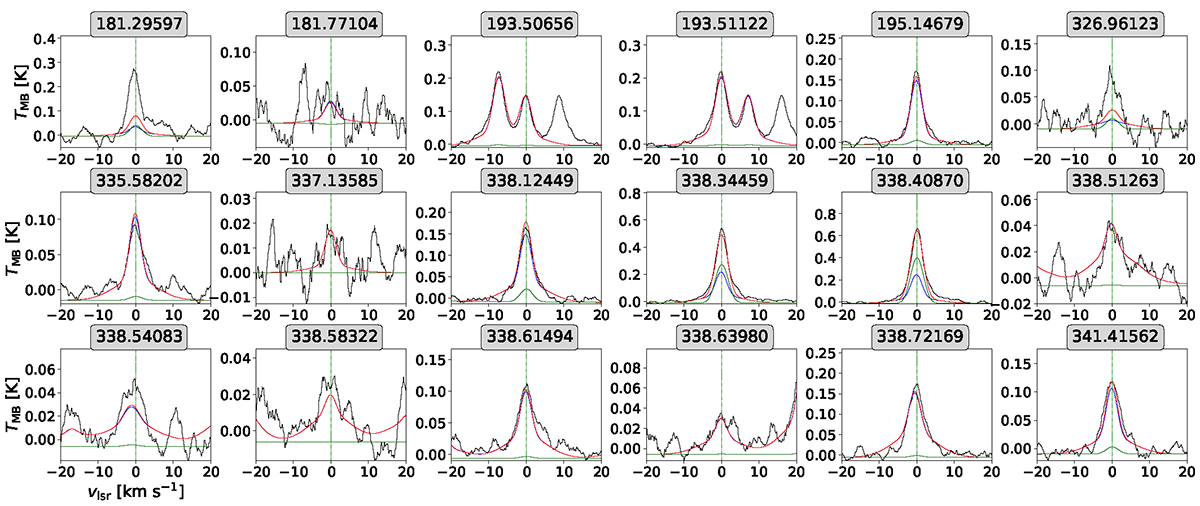
Non-LTE plus LTE modeling for the CARMA-7 spectrum obtained from the best-fitting results (see Table 1). Line rest frequencies are indicated at the top of each subpanel. Rest-frame velocities and temperatures are labeled at the bottom and left-side positions in each subpanel. Observed spectra are shown in black, LTE modeling (narrow plus broad components) is indicated in blue, RADEX modeling is in green, and the combination of LTE plus RADEX emission is in red. An LSR velocity of ∼7.8 ± 1.0 km s−1 (see Sect. 2.3, Fig. 1, and Table 1 for the used references, initially adopted and calculated VLSR, respectively) was previously subtracted.
Current usage metrics show cumulative count of Article Views (full-text article views including HTML views, PDF and ePub downloads, according to the available data) and Abstracts Views on Vision4Press platform.
Data correspond to usage on the plateform after 2015. The current usage metrics is available 48-96 hours after online publication and is updated daily on week days.
Initial download of the metrics may take a while.