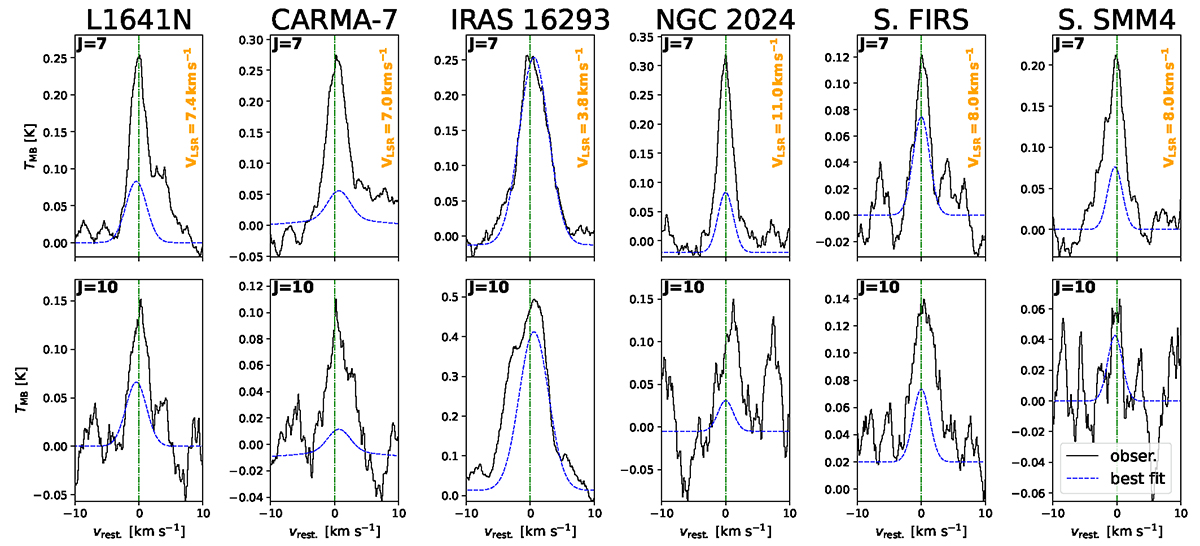
Fig. 1.
Download original image
Rest frame J−1 → (J − 1)0 − E methanol J = 7 and 10 transition spectra of our subsample (Sect. 2.1, solid black lines), along with the rotation diagram best fits (dashed blue lines, see Fig. B.1). The Local Standard of Rest velocities (VLSR; labeled in orange) of the different sources were obtained from the literature where we assume a common uncertainty of 1.0 km s−1 (see Sect. 2.3).
Current usage metrics show cumulative count of Article Views (full-text article views including HTML views, PDF and ePub downloads, according to the available data) and Abstracts Views on Vision4Press platform.
Data correspond to usage on the plateform after 2015. The current usage metrics is available 48-96 hours after online publication and is updated daily on week days.
Initial download of the metrics may take a while.