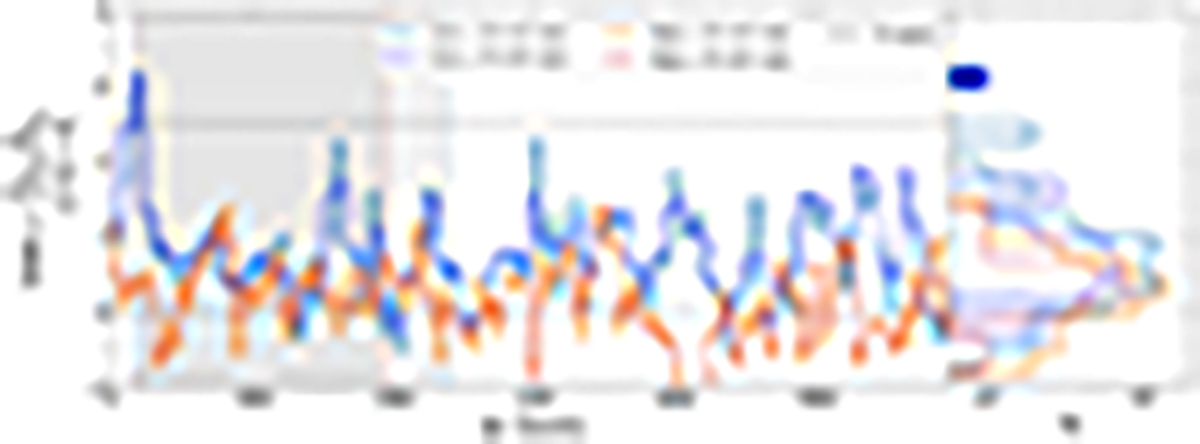
Fig. B.1.
Download original image
Significance of the flux decrement near Δν = 0. In the left panel, the S/N per pixel is illustrated for different binning windows for the two redshift bins. The gray shadow area corresponds to the fit region, while FS (σS) and FL (σL) represent the (errors on the) flux of the short and long gaps respectively. The right panel shows the significance distribution within the (gray) fit region. The pixels with an S/N larger than 5 are highlighted.
Current usage metrics show cumulative count of Article Views (full-text article views including HTML views, PDF and ePub downloads, according to the available data) and Abstracts Views on Vision4Press platform.
Data correspond to usage on the plateform after 2015. The current usage metrics is available 48-96 hours after online publication and is updated daily on week days.
Initial download of the metrics may take a while.