Fig. 2.
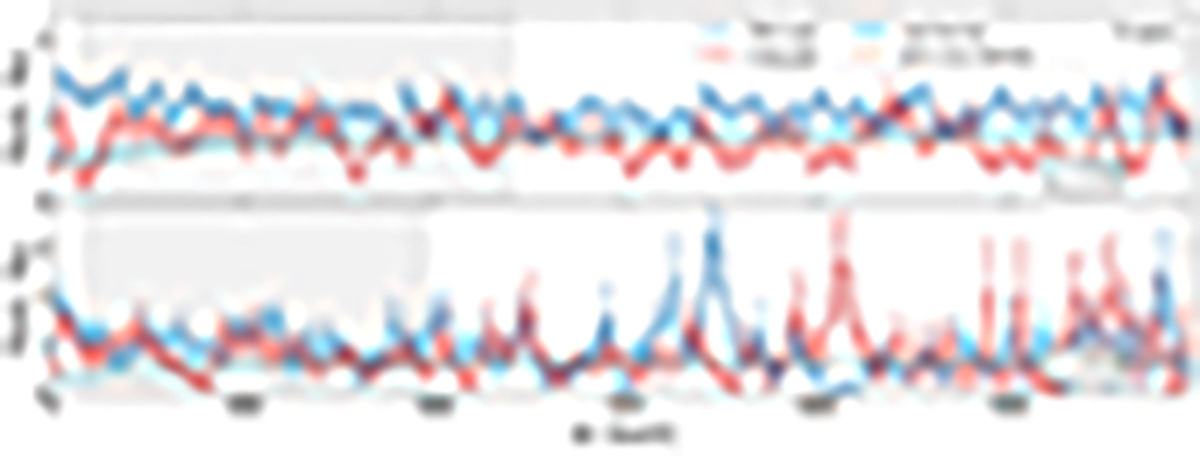
Download original image
Stacked spectrum around long and short gaps for two redshift bins (top: z = 5.6, bottom: z = 5.9). In each panel, the red and blue curves depict the stacked profiles of long and short gaps, respectively, with their widths being the uncertainties from bootstrap resampling. The continuous light blue line and the dotted orange line indicate the best-fit transmission model fit to the stack around long gaps for the step-function model and the piecewise model, respectively. Long gaps are defined as those with velocity widths greater than 340 km s−1, while short gaps have lengths under 200 km s−1. The curves in the bottom panel show the models that are permitted at a 2σ level.
Current usage metrics show cumulative count of Article Views (full-text article views including HTML views, PDF and ePub downloads, according to the available data) and Abstracts Views on Vision4Press platform.
Data correspond to usage on the plateform after 2015. The current usage metrics is available 48-96 hours after online publication and is updated daily on week days.
Initial download of the metrics may take a while.