Fig. 9
Download original image
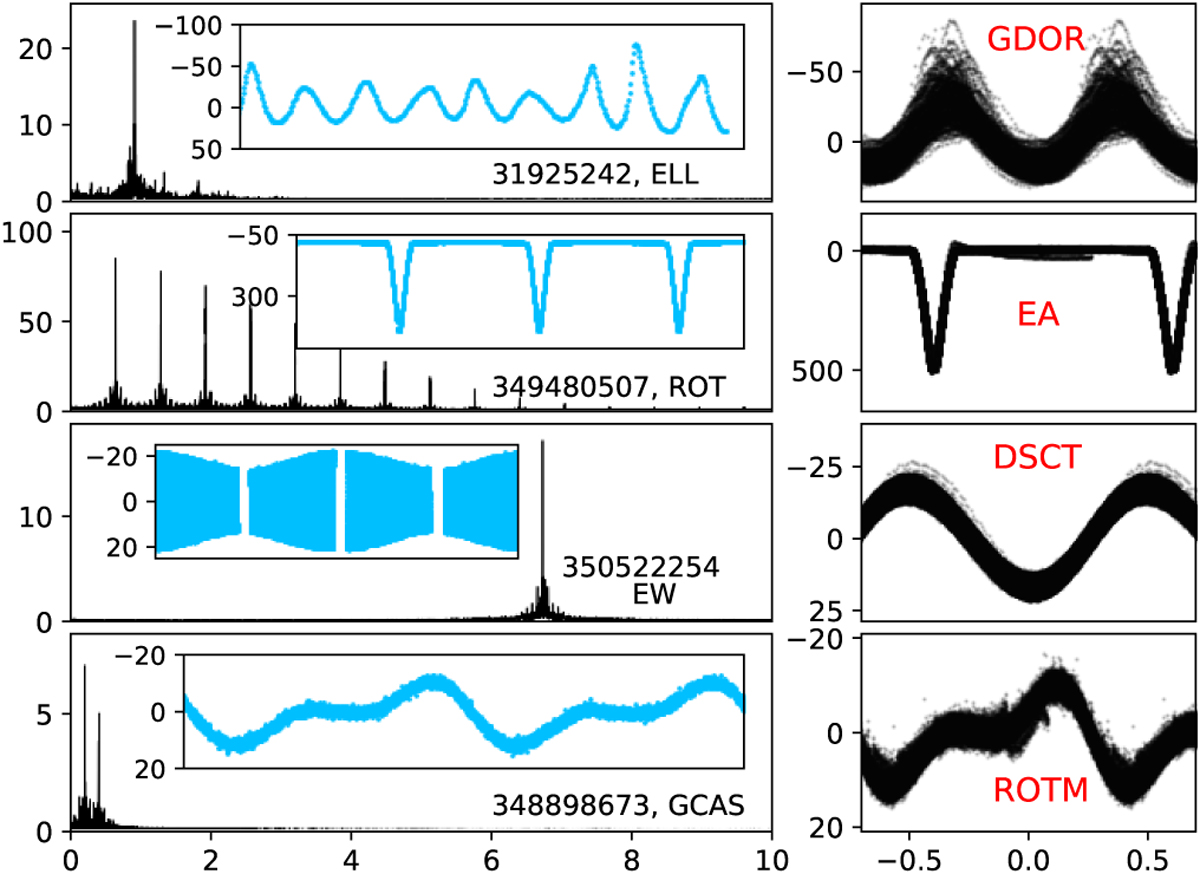
Stars with incorrect classification in the catalogues. The left panels show the frequency spectra with the part of the time series (the catalogue classification is given together with the TIC number), while the right-hand panels show the data phase-folded with the dominant frequency together with the correct variability type.
Current usage metrics show cumulative count of Article Views (full-text article views including HTML views, PDF and ePub downloads, according to the available data) and Abstracts Views on Vision4Press platform.
Data correspond to usage on the plateform after 2015. The current usage metrics is available 48-96 hours after online publication and is updated daily on week days.
Initial download of the metrics may take a while.