Fig. 3.
Download original image
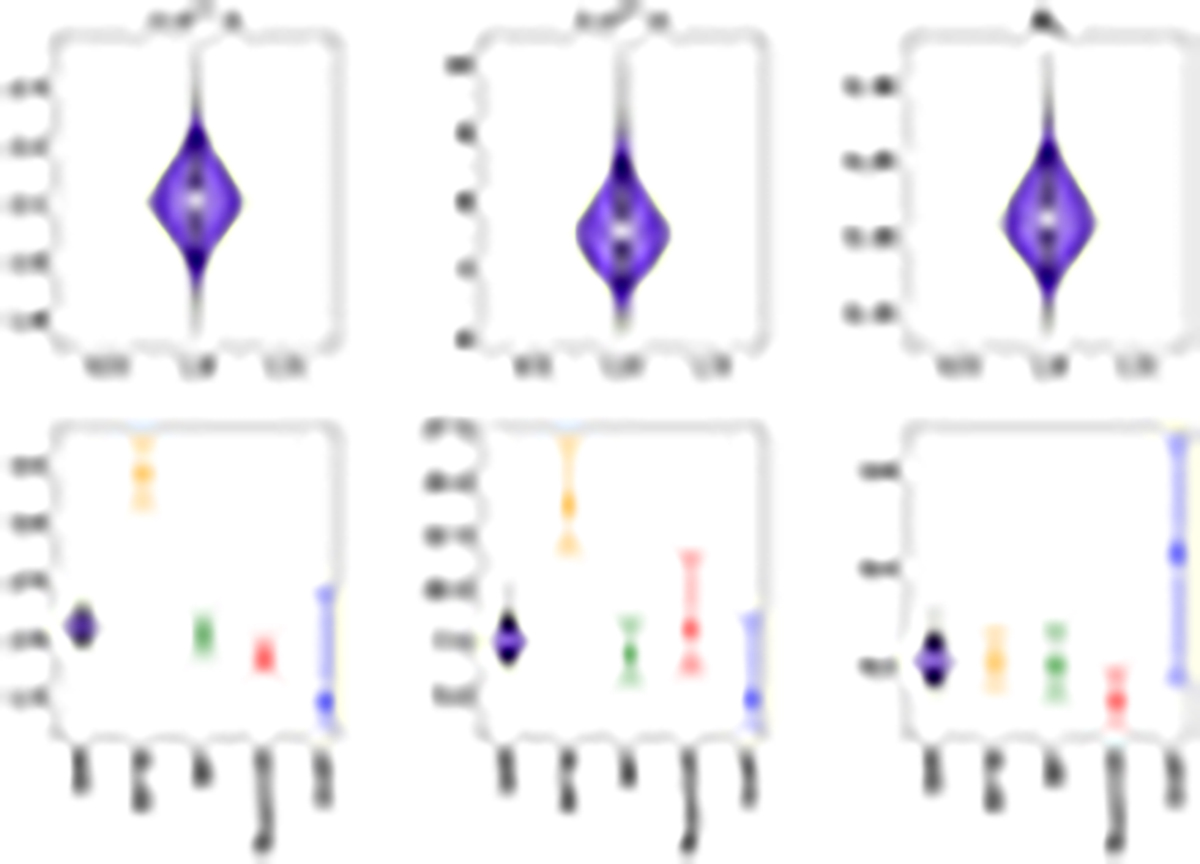
This figure describes our present results compared with those of G24. Top panels, left to right: violin plots of the posterior distributions of the three parameters ⟨n(1)⟩, ⟨n(2)⟩, and ![]() , respectively representing the expected number of peaks per GRB of the peak-poor and the peak-rich classes, and the fraction of peak-rich GRBs obtained for the GBM sample. The horizontal bars span 5–95% quantiles. Bottom panels, left to right: comparison between the results obtained for the same parameters in this work, with those obtained by G24 from other catalogues.
, respectively representing the expected number of peaks per GRB of the peak-poor and the peak-rich classes, and the fraction of peak-rich GRBs obtained for the GBM sample. The horizontal bars span 5–95% quantiles. Bottom panels, left to right: comparison between the results obtained for the same parameters in this work, with those obtained by G24 from other catalogues.
Current usage metrics show cumulative count of Article Views (full-text article views including HTML views, PDF and ePub downloads, according to the available data) and Abstracts Views on Vision4Press platform.
Data correspond to usage on the plateform after 2015. The current usage metrics is available 48-96 hours after online publication and is updated daily on week days.
Initial download of the metrics may take a while.