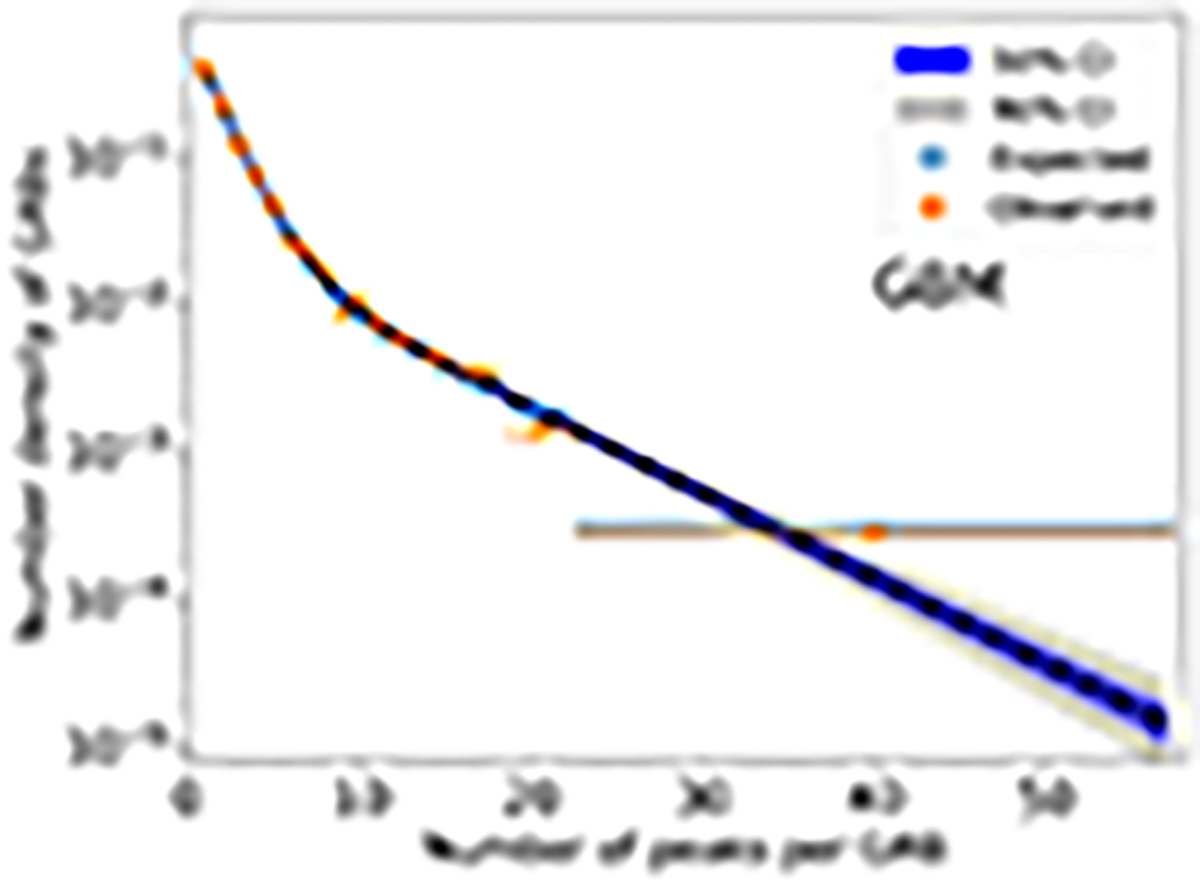
Fig. 1.
Download original image
Distribution of the number of peaks per GRB for the Fermi/GBM catalogue. The observed and expected counts are displayed in orange and blue, respectively. The histogram bins were grouped to ensure a minimum number of 15 expected counts per bin. The dashed black line shows the best-fitting model of mixture of two exponentials. The blue and grey regions respectively show the 50% and 90% model confidence interval obtained from sampling the posterior distribution of the model parameters computed through Markov chain Monte Carlo simulations.
Current usage metrics show cumulative count of Article Views (full-text article views including HTML views, PDF and ePub downloads, according to the available data) and Abstracts Views on Vision4Press platform.
Data correspond to usage on the plateform after 2015. The current usage metrics is available 48-96 hours after online publication and is updated daily on week days.
Initial download of the metrics may take a while.