Fig. 11.
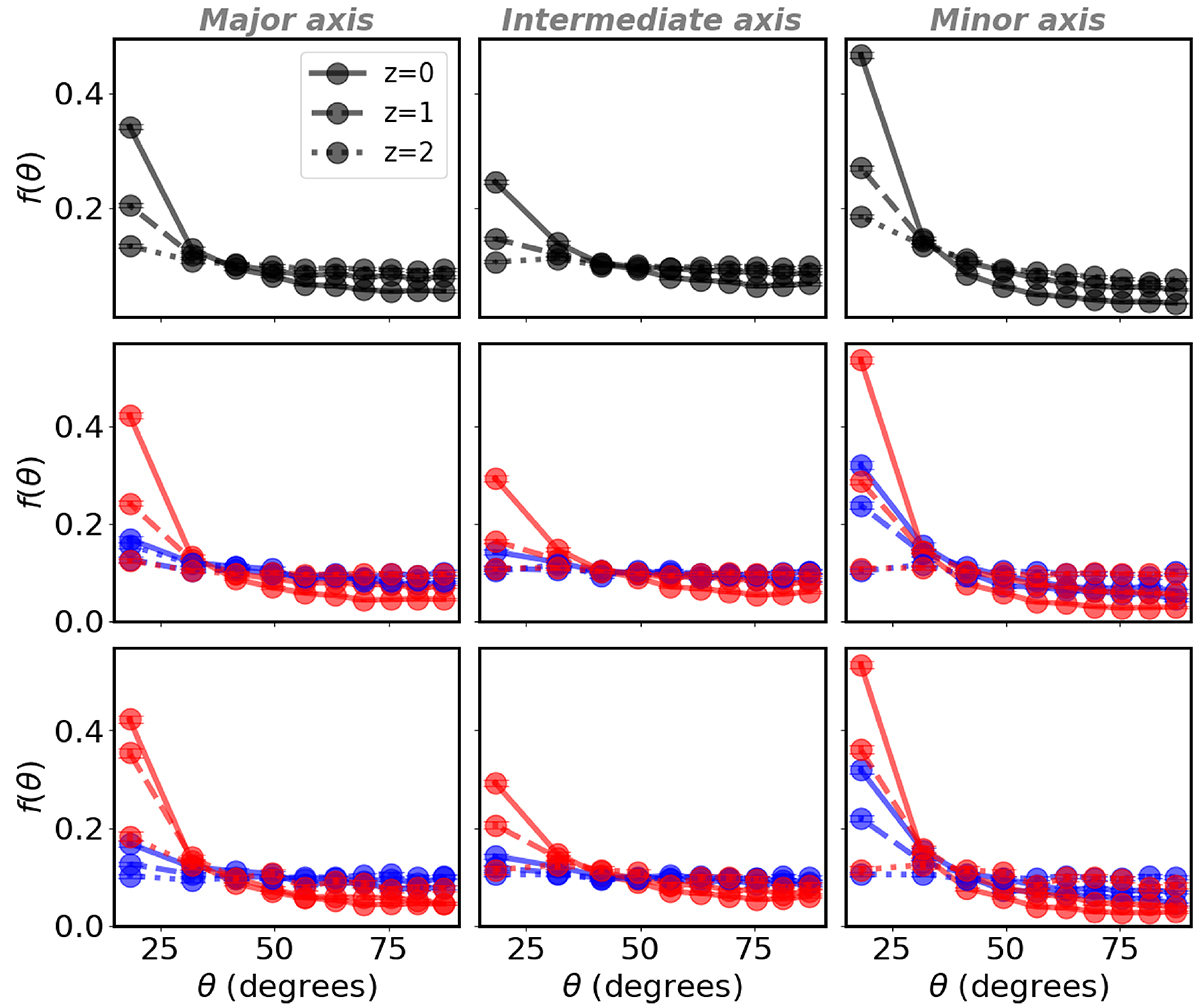
Download original image
Evolution of the measured probability density distribution of the alignment between the dark matter and stars of the central galaxy for each of the shape tensor axes. From left to right, the major, intermediate, and minor axes are illustrated. The top panels show the results for the total sample, while the middle panels present those specific to the red and blue galaxies at z = 0. Finally, the bottom panels show the findings for galaxies divided by colour with the corresponding cut-off for each redshift. Line types indicate redshifts: continuous for z = 0, dashed for z = 1, and dotted for z = 2.
Current usage metrics show cumulative count of Article Views (full-text article views including HTML views, PDF and ePub downloads, according to the available data) and Abstracts Views on Vision4Press platform.
Data correspond to usage on the plateform after 2015. The current usage metrics is available 48-96 hours after online publication and is updated daily on week days.
Initial download of the metrics may take a while.