Fig. 1.
Download original image
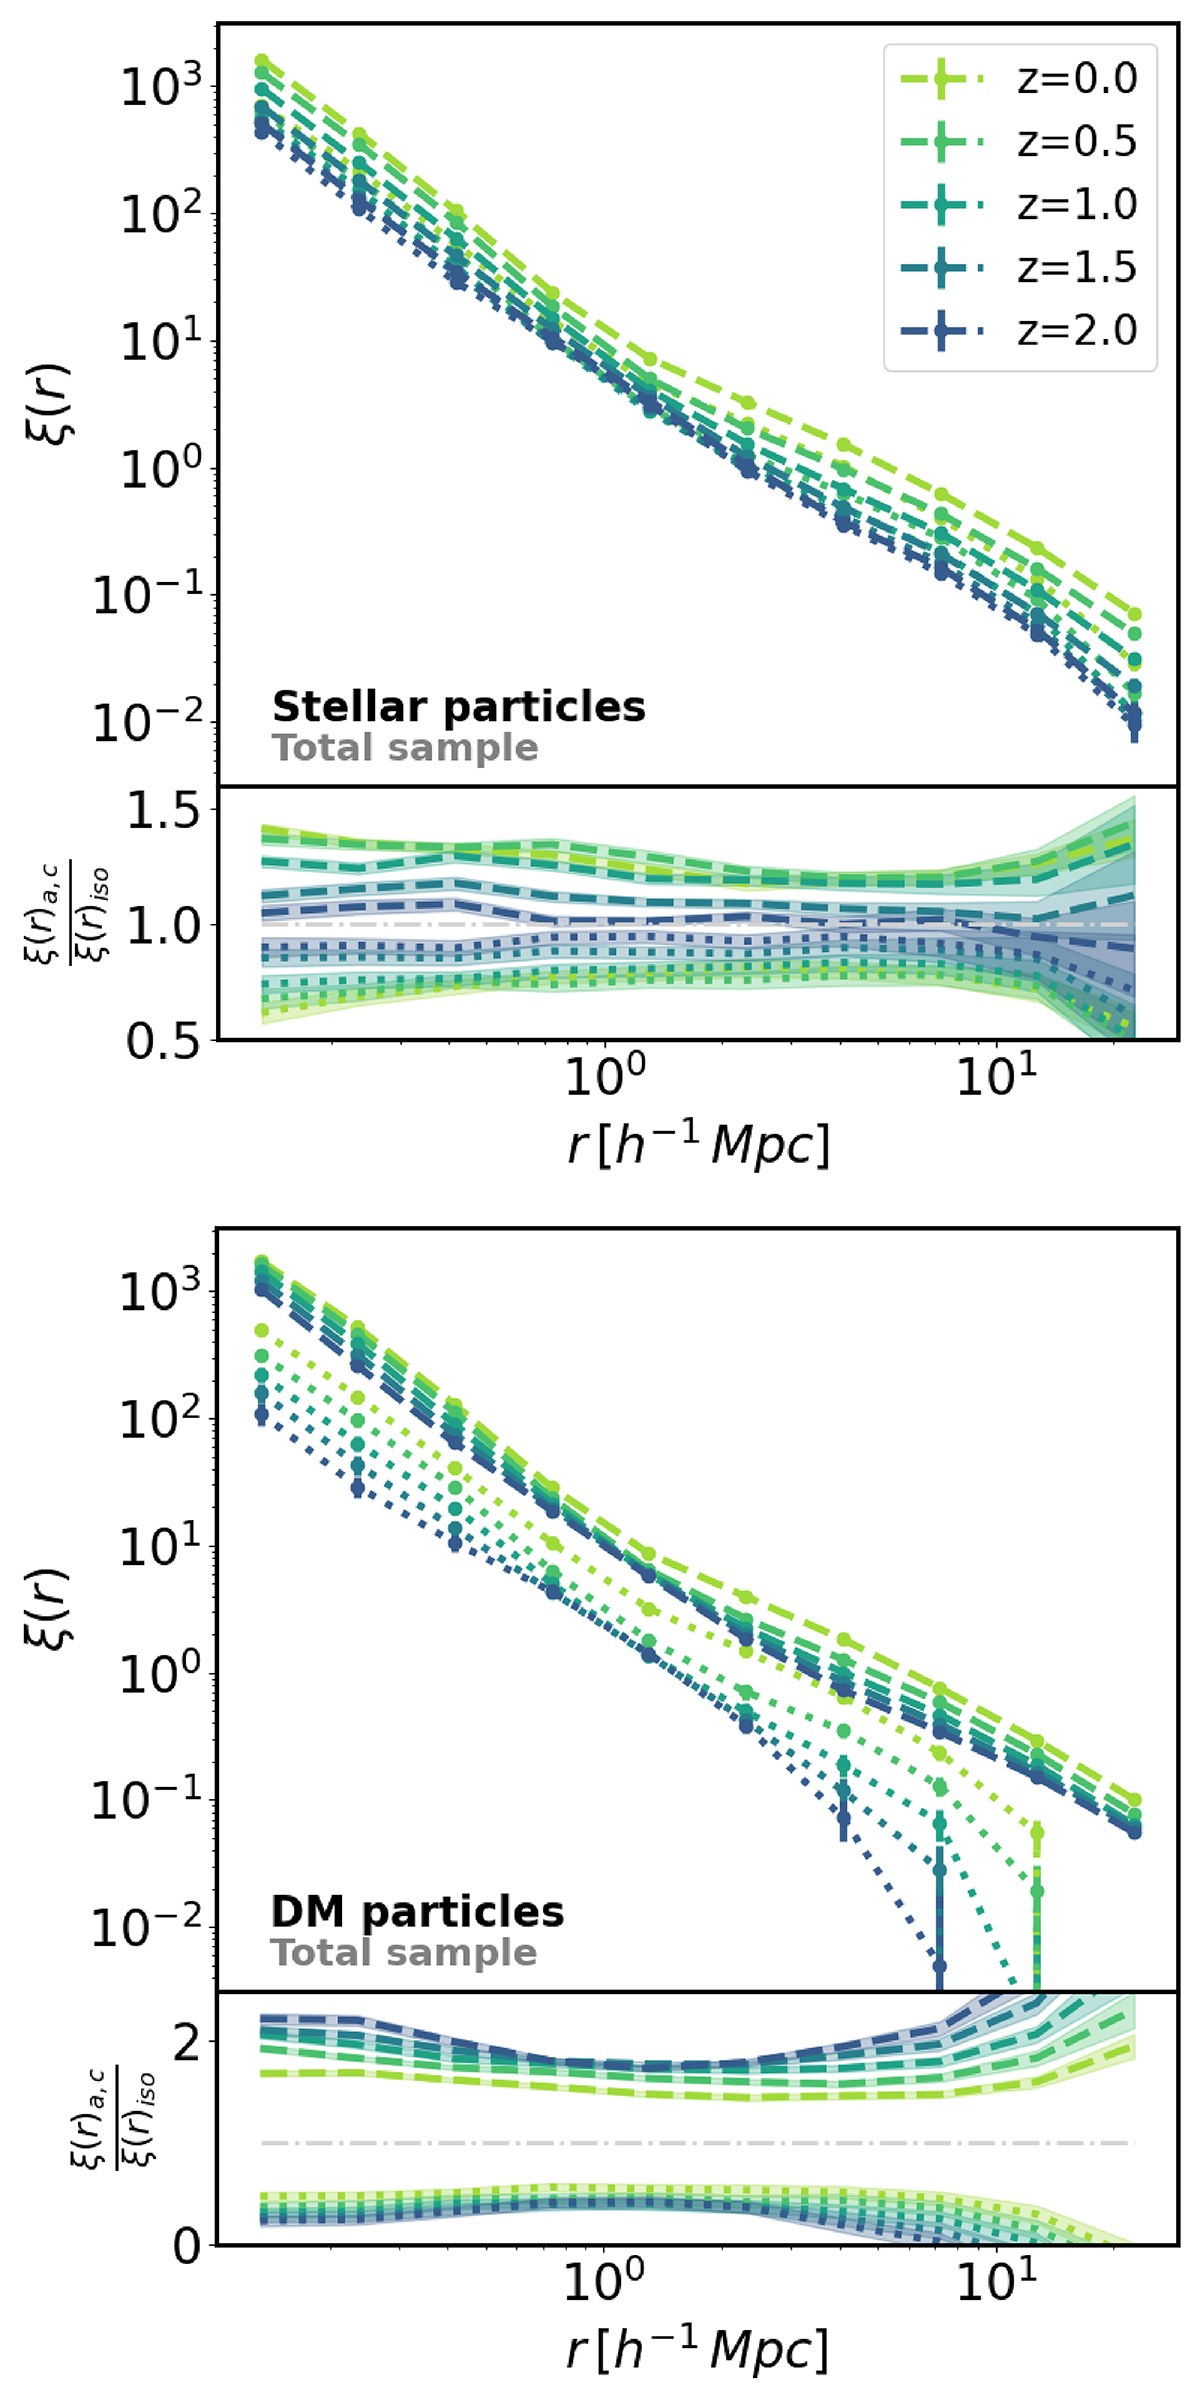
Anisotropic correlation function at redshifts z = 0, 0.5, 1, 1.5, and 2 for the central galaxies shape axes computed using stellar particles (top panel) and dark matter particles (bottom panel). The subpanels present the ratio between the correlation function along the ![]() and
and ![]() axes and the isotropic correlation function (dashed and dotted lines, respectively) for the five redshifts studied. The colours aid in tracking the evolution, as they get darker with increasing redshift.
axes and the isotropic correlation function (dashed and dotted lines, respectively) for the five redshifts studied. The colours aid in tracking the evolution, as they get darker with increasing redshift.
Current usage metrics show cumulative count of Article Views (full-text article views including HTML views, PDF and ePub downloads, according to the available data) and Abstracts Views on Vision4Press platform.
Data correspond to usage on the plateform after 2015. The current usage metrics is available 48-96 hours after online publication and is updated daily on week days.
Initial download of the metrics may take a while.