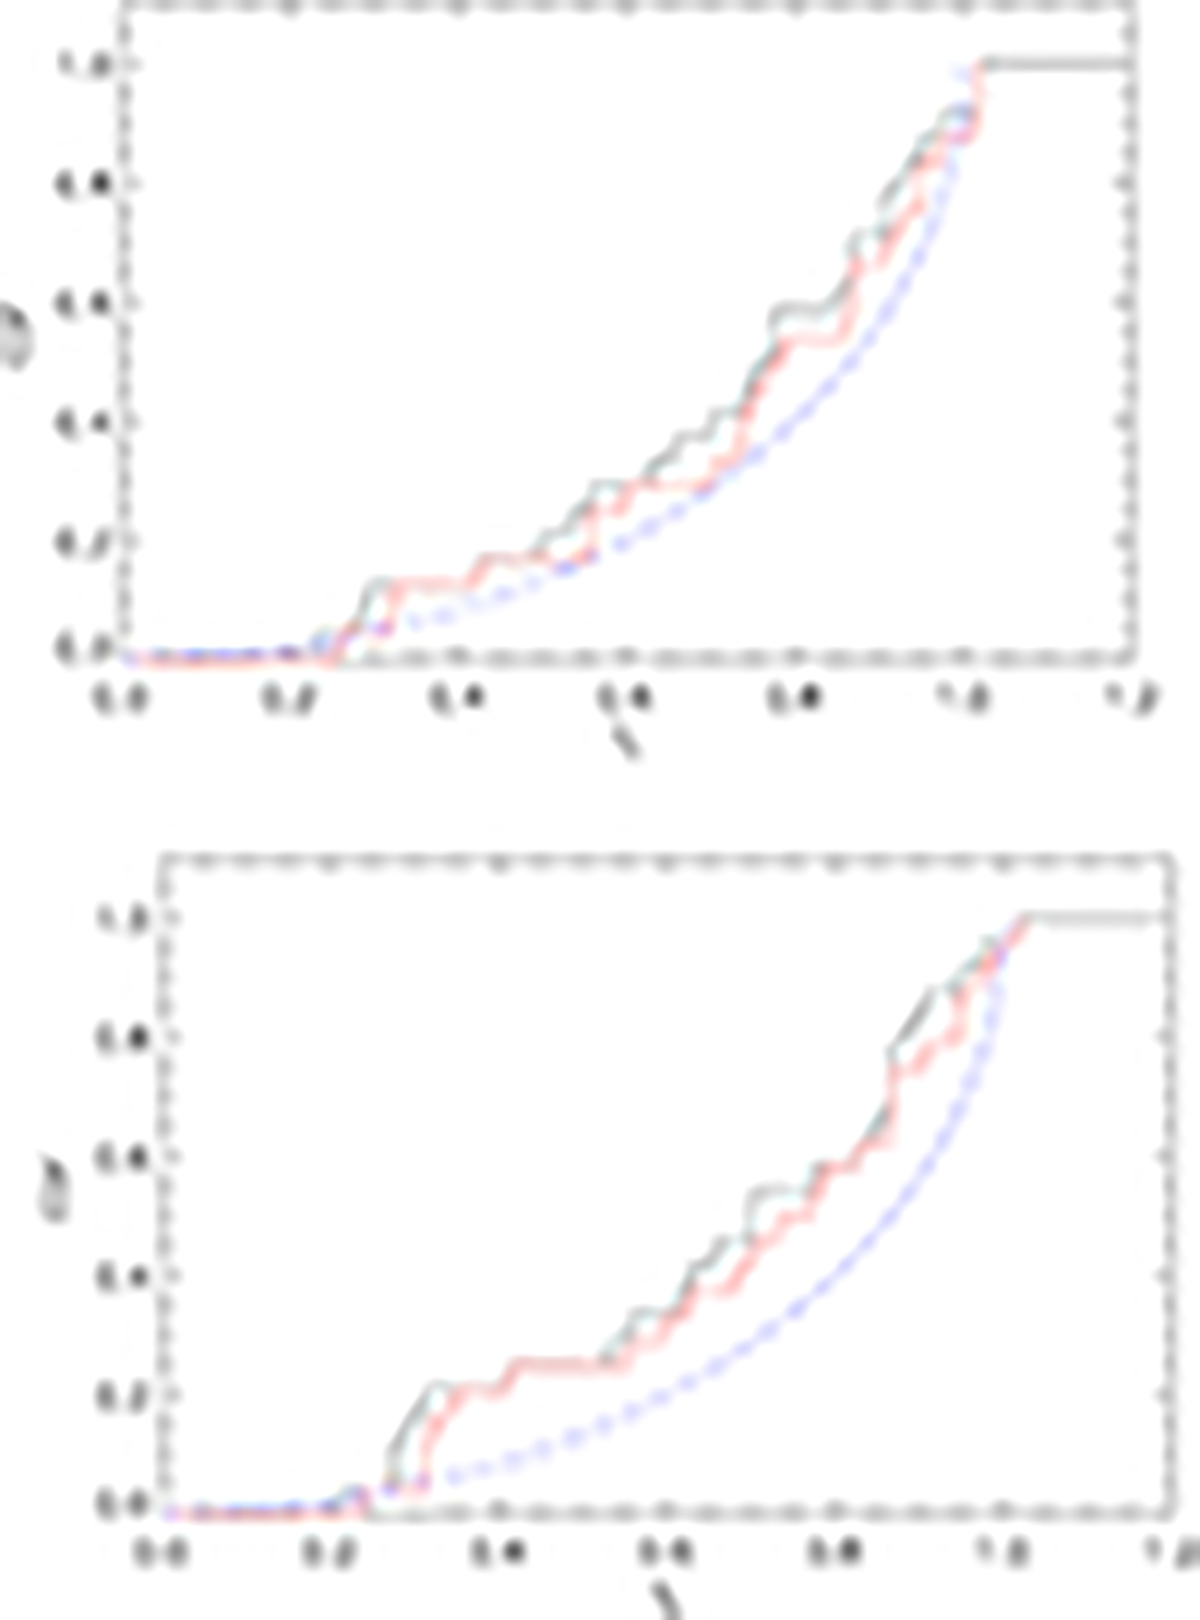
Fig. 3.
Download original image
Cumulative distribution functions for the log fc- and log fp-values for systems with log P < 3 days. The black curves assume that the SB1 secondaries contribute negligible flux, whilst the red curves assume that they contribute 20% of the total flux. The dotted blue curves are the expected behaviour for synchronous rotation, alignment of the rotational and orbital axes and a random distribution of orbital axes.
Current usage metrics show cumulative count of Article Views (full-text article views including HTML views, PDF and ePub downloads, according to the available data) and Abstracts Views on Vision4Press platform.
Data correspond to usage on the plateform after 2015. The current usage metrics is available 48-96 hours after online publication and is updated daily on week days.
Initial download of the metrics may take a while.