Fig. 6
Download original image
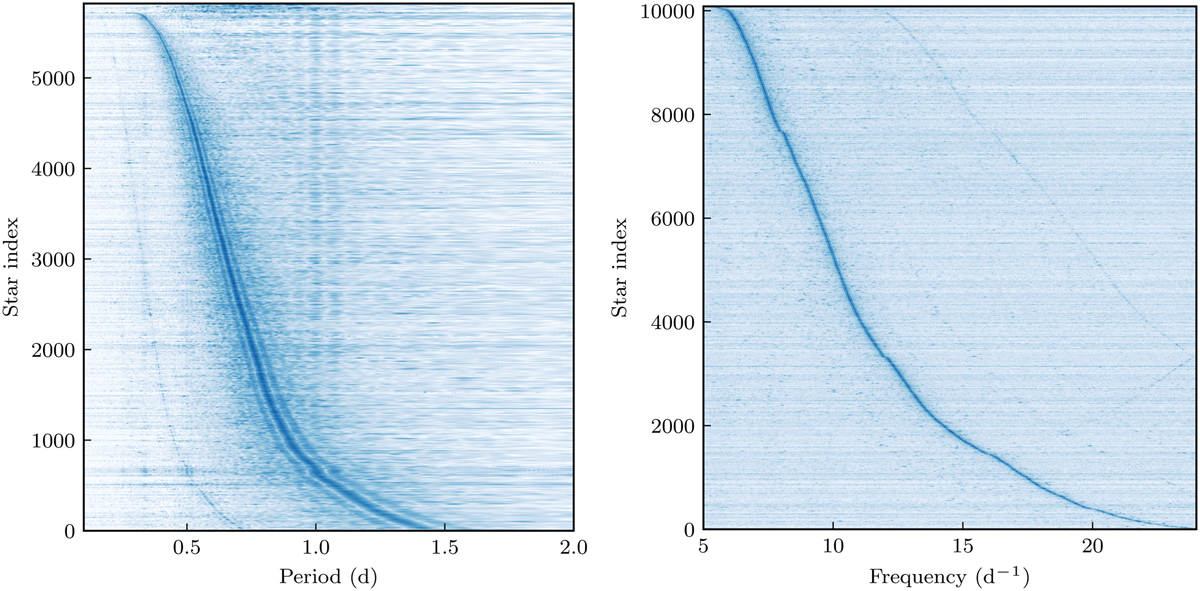
Stacked amplitude spectra of the g-mode candidate sample (left, in period space) and δ Scuti candidate sample (right, in frequency space) for which the prediction probability is greater than 0.5. Each star forms a single row, sorted by the dominant pulsation, with the colour corresponding to the amplitude. For the g-mode sample, which comprises both the γ Dor and SPB stars, we see a distinct secondary ridge associated with either a harmonic of the dominant frequency or the expected ℓ = 2 dipole modes seen in Li et al. (2020). For the δ Scuti sample, we see ridges associated with the first and second overtones, as well as a harmonic line.
Current usage metrics show cumulative count of Article Views (full-text article views including HTML views, PDF and ePub downloads, according to the available data) and Abstracts Views on Vision4Press platform.
Data correspond to usage on the plateform after 2015. The current usage metrics is available 48-96 hours after online publication and is updated daily on week days.
Initial download of the metrics may take a while.