Fig. 1
Download original image
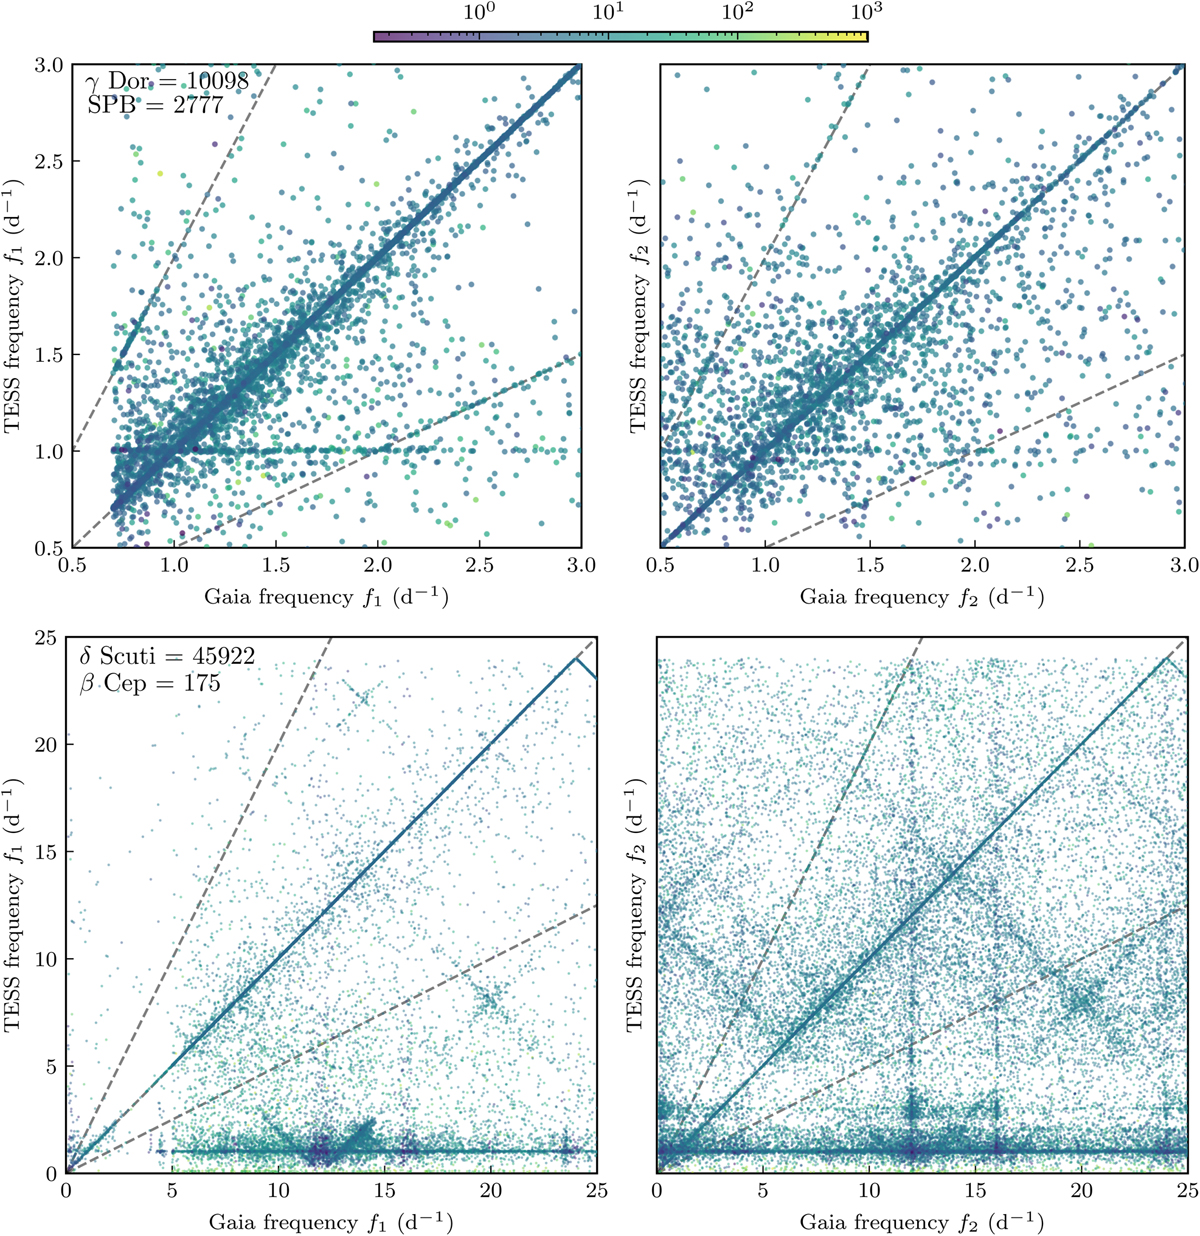
Comparison of dominant and secondary frequencies between Gaia and TESS. Left: comparison of the measured dominant TESS frequency against the Gaia frequency for the g-mode pulsators (top) and p-mode pulsators (bottom), coloured by the amplitude of the variability (ppt). Right: same but for the secondary frequency. The dashed lines indicate the half, unity, and twice relationships among the frequencies. We compare the sample of g-mode candidate pulsators before removing combination frequencies, to match the method of Aerts et al. (2023). The crisscross structures in the p-mode plots are caused by aliases of the true signal around the Nyquist limit.
Current usage metrics show cumulative count of Article Views (full-text article views including HTML views, PDF and ePub downloads, according to the available data) and Abstracts Views on Vision4Press platform.
Data correspond to usage on the plateform after 2015. The current usage metrics is available 48-96 hours after online publication and is updated daily on week days.
Initial download of the metrics may take a while.