Open Access
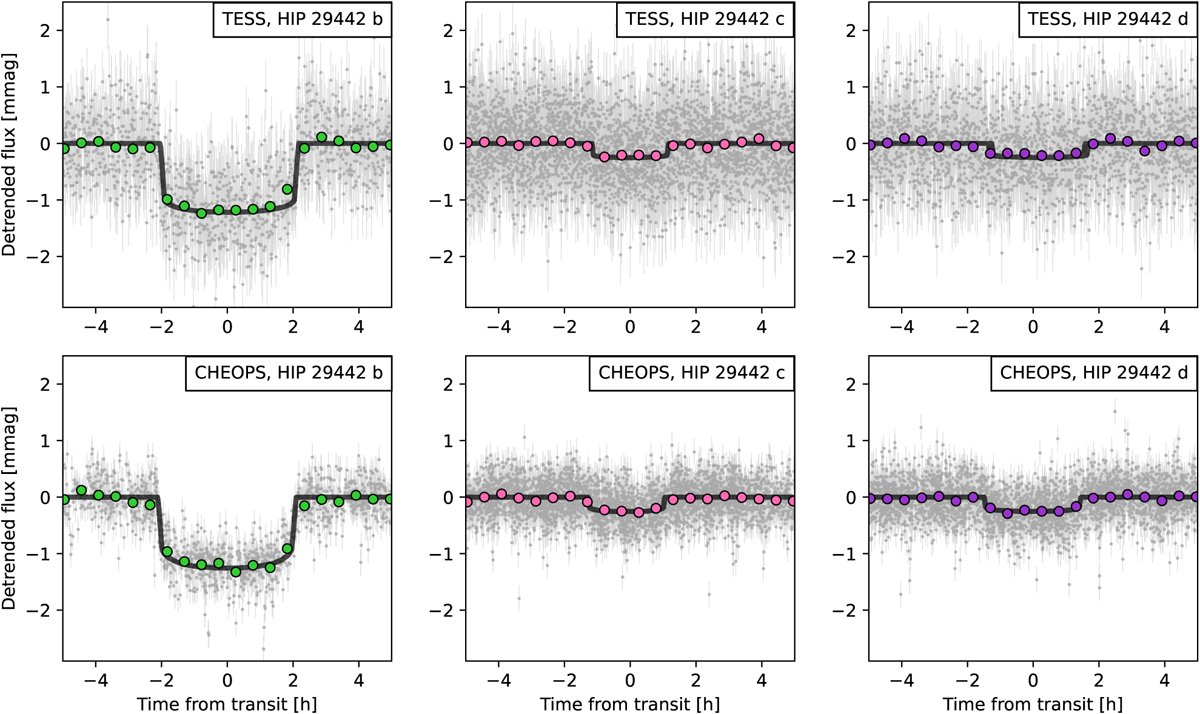
Fig. 1
Download original image
Detrended TESS (top row) and CHEOPS (bottom row) light curves, phase-folded to the orbital periods of HIP 29442 b (left), c (middle), and d (right). The coloured points show the 30 min binned data; the solid black lines show the best-fit transit models.
Current usage metrics show cumulative count of Article Views (full-text article views including HTML views, PDF and ePub downloads, according to the available data) and Abstracts Views on Vision4Press platform.
Data correspond to usage on the plateform after 2015. The current usage metrics is available 48-96 hours after online publication and is updated daily on week days.
Initial download of the metrics may take a while.