Fig. 5.
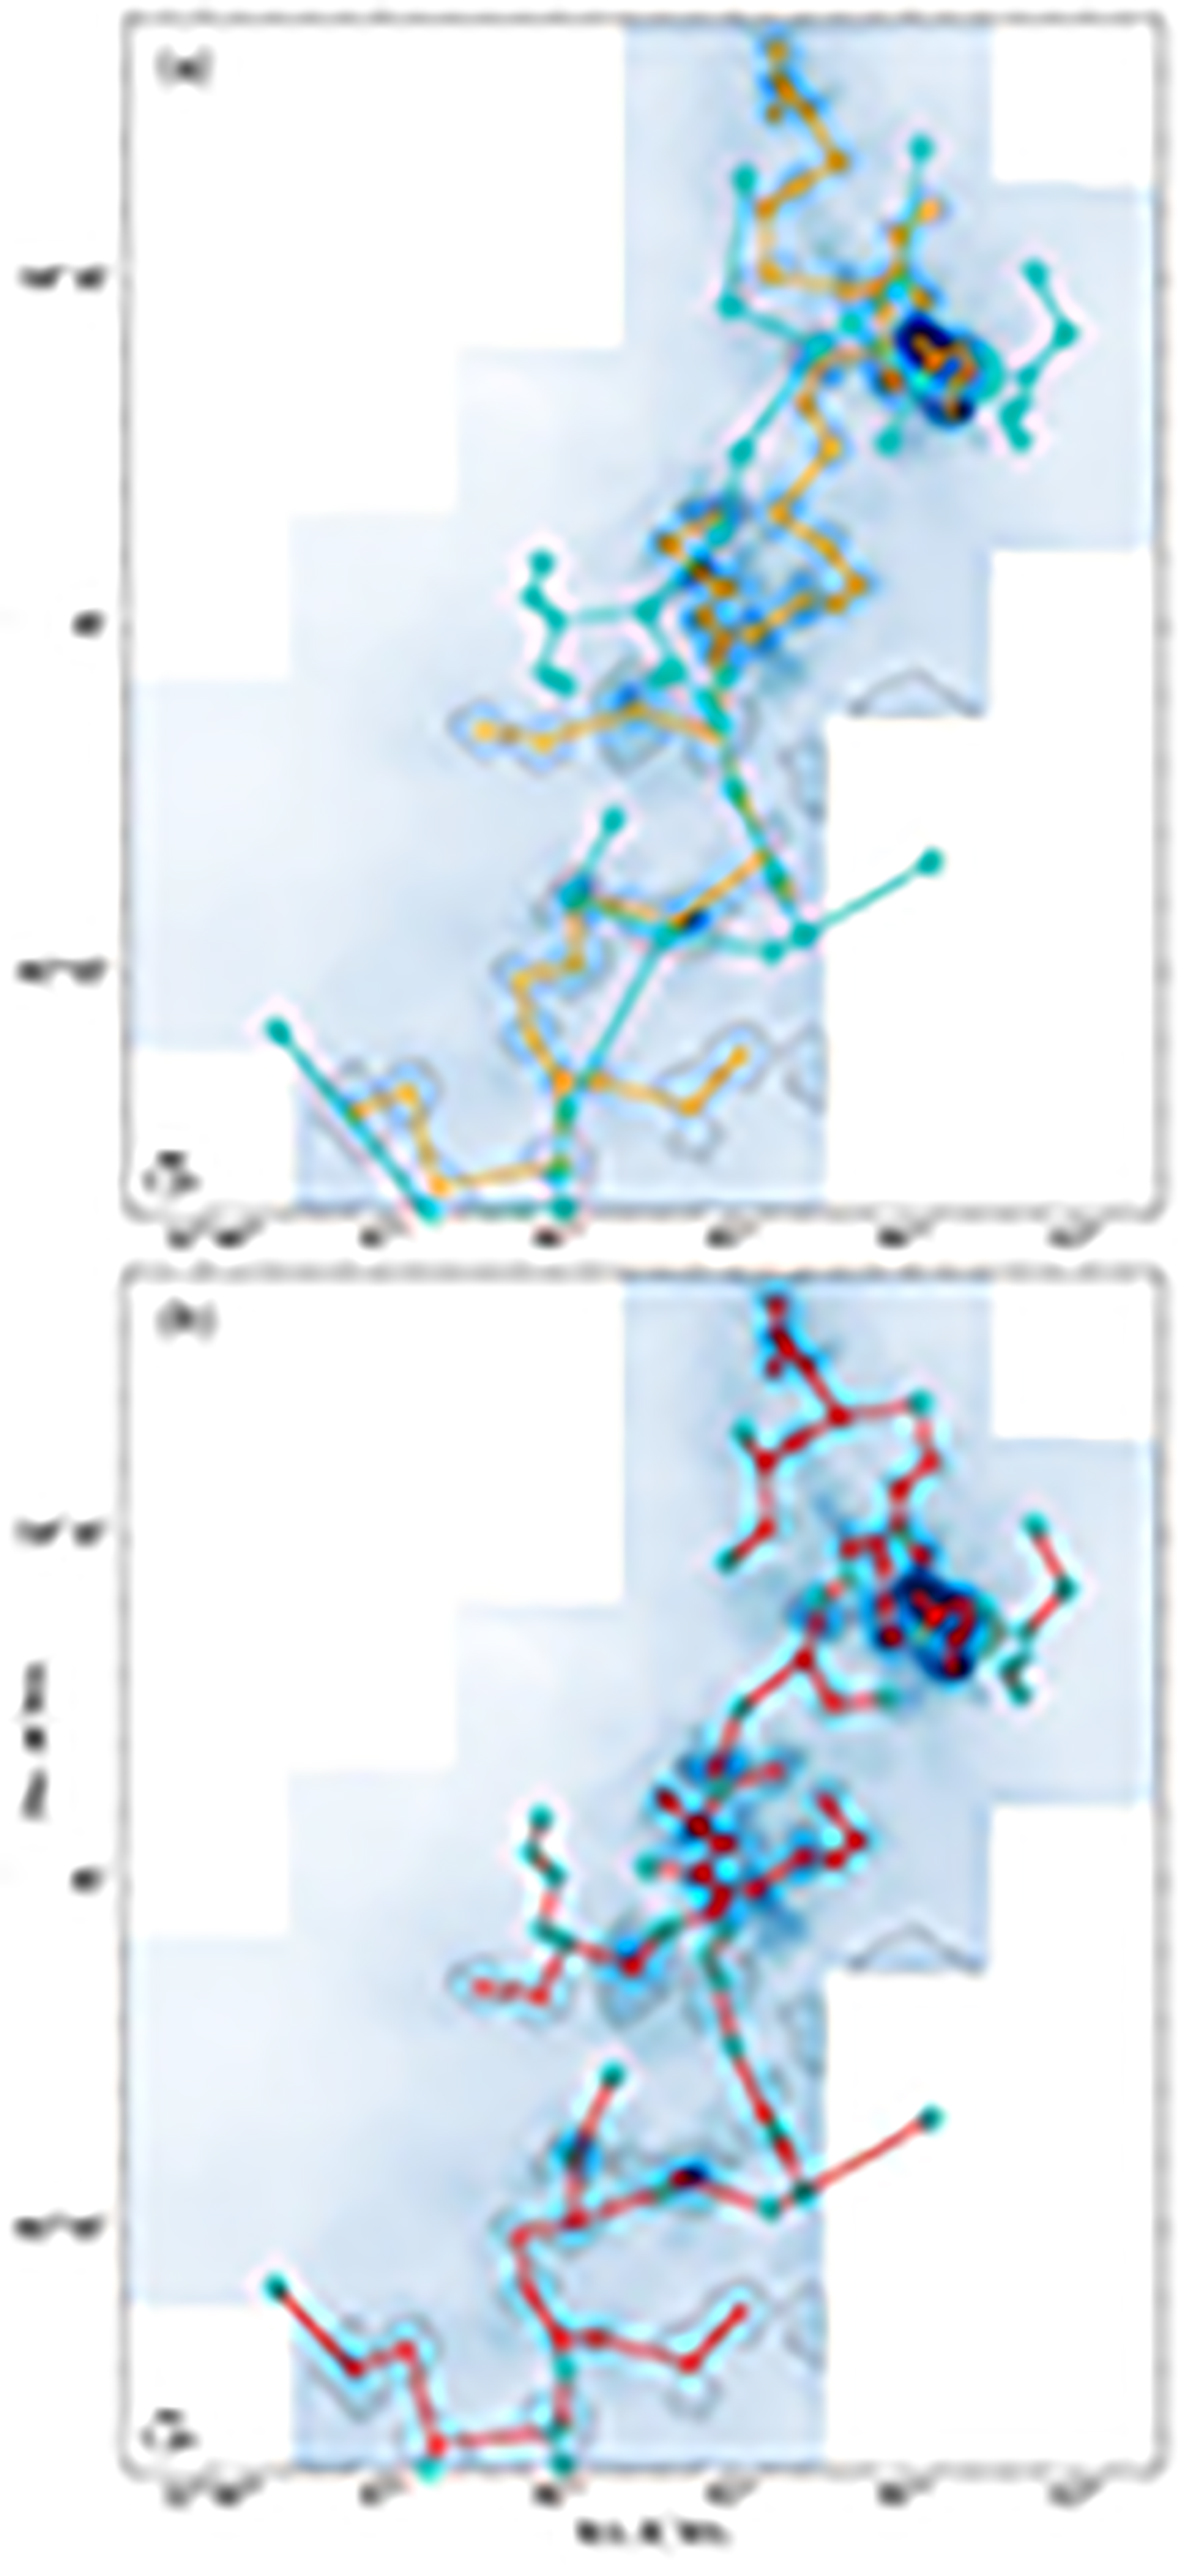
Download original image
Carina nebula illustrates as an example the minimum spanning tree (MST) method. The cyan plus marks the positions of ATLASGAL clumps. The black contours show the masks of leaf clusters. (a) Orange and cyan lines show the minimum spanning trees between clusters and between clumps, respectively. (b) MST between clusters and clumps.
Current usage metrics show cumulative count of Article Views (full-text article views including HTML views, PDF and ePub downloads, according to the available data) and Abstracts Views on Vision4Press platform.
Data correspond to usage on the plateform after 2015. The current usage metrics is available 48-96 hours after online publication and is updated daily on week days.
Initial download of the metrics may take a while.