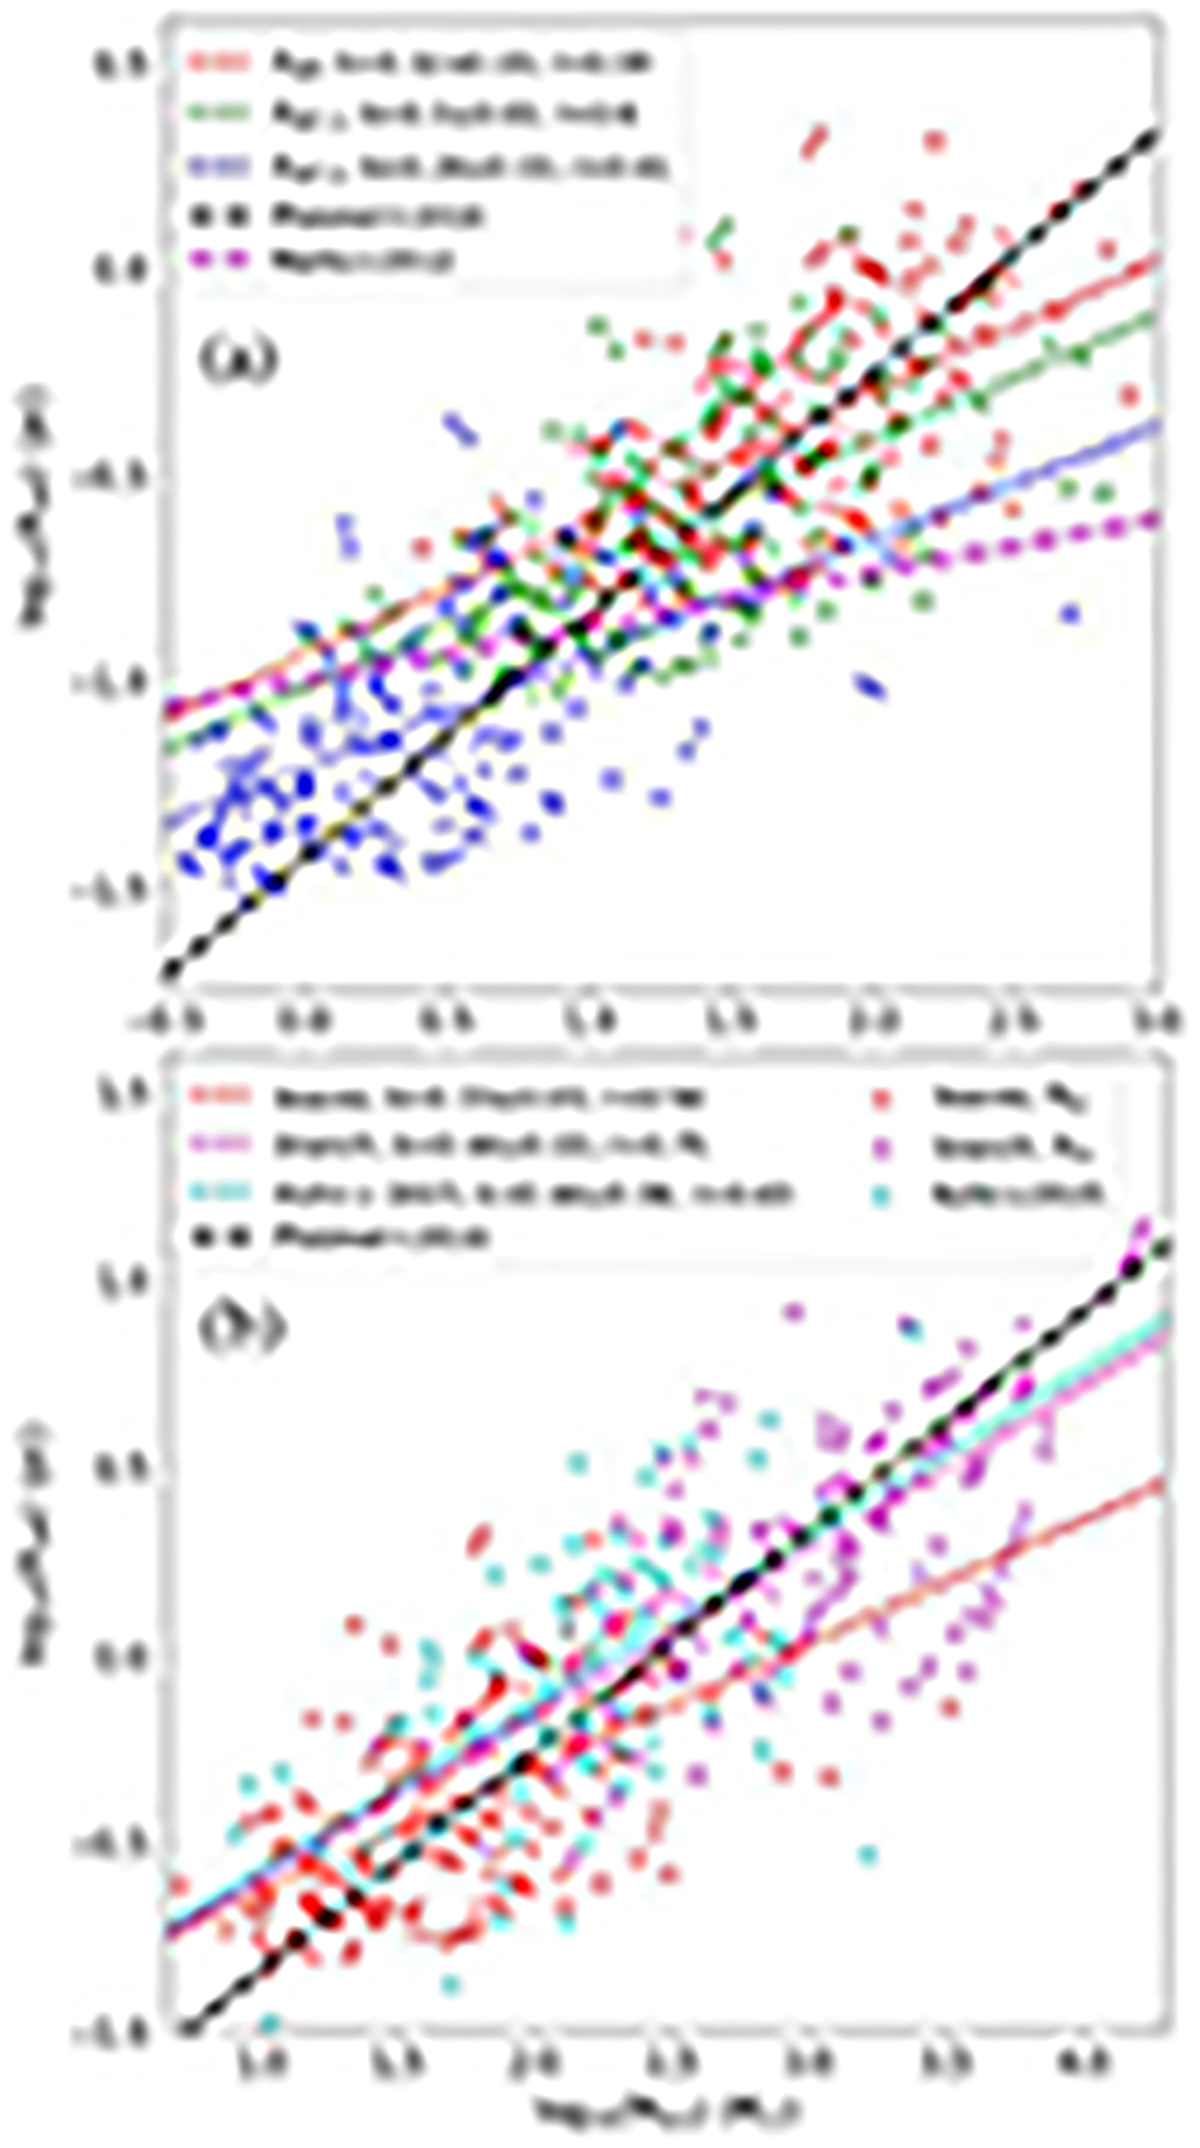
Fig. 4.
Download original image
Mass-size relation of star clusters measured at different scales. (a) Red, green, and blue pluses represent leaf clusters with effective radii Reff, Reff, 1, and Reff, 2 defined in Sect. 3.3 and marked by colored ellipses in Fig. 1(a), respectively. (b) Magenta, cyan, and red pluses represent branch clusters, which are the subclusters in Table 1 of Kuhn et al. (2015b), and leaf clusters, respectively. k and r are the slope of the mass-size relation and the Pearson correlation coefficient, respectively.
Current usage metrics show cumulative count of Article Views (full-text article views including HTML views, PDF and ePub downloads, according to the available data) and Abstracts Views on Vision4Press platform.
Data correspond to usage on the plateform after 2015. The current usage metrics is available 48-96 hours after online publication and is updated daily on week days.
Initial download of the metrics may take a while.