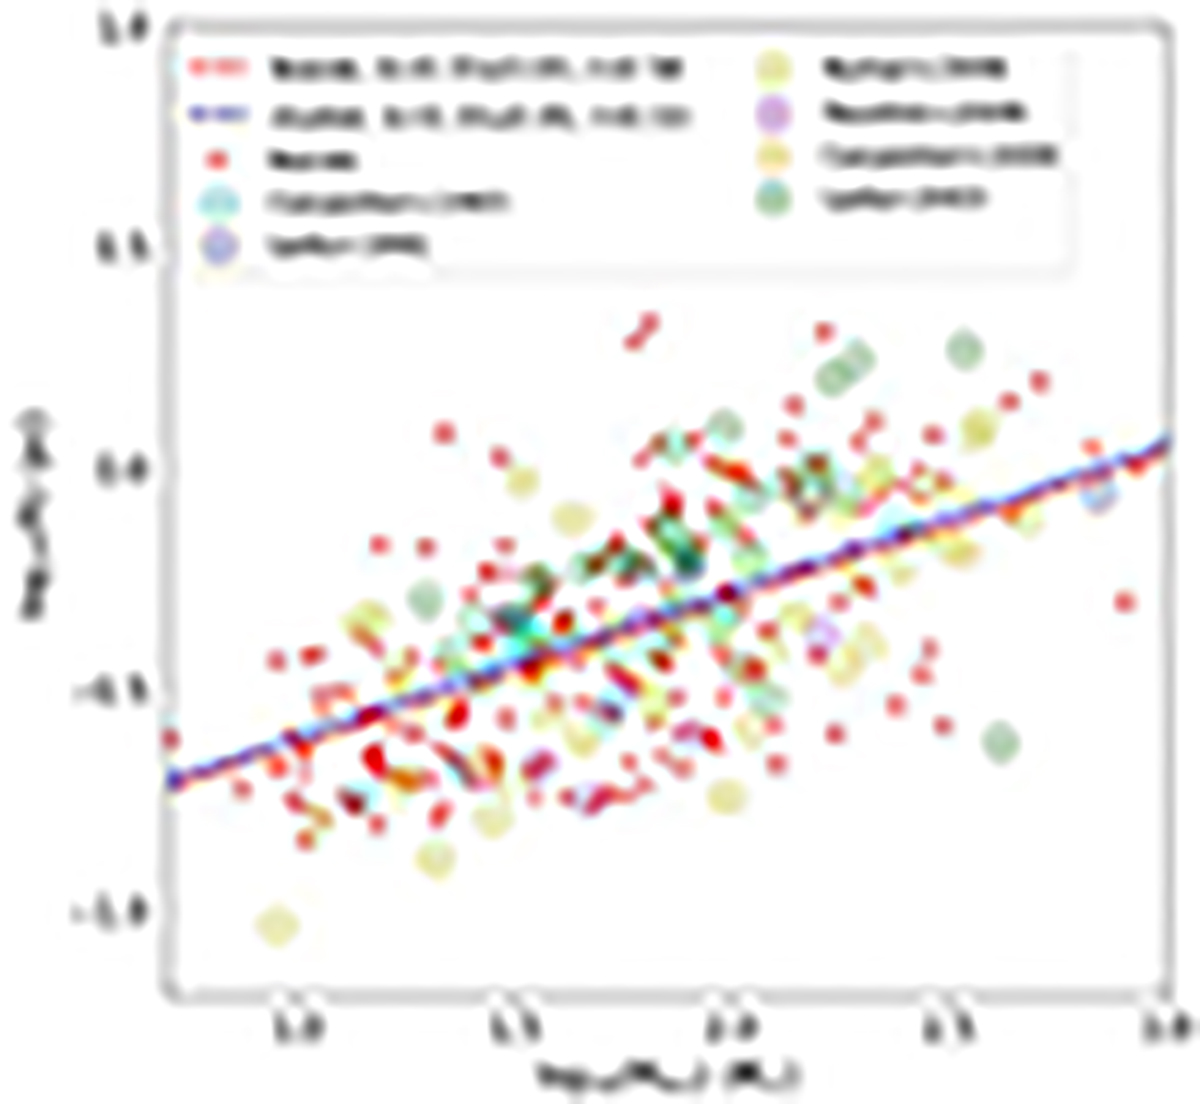
Fig. 3.
Download original image
Mass-size relations of leaf clusters (red plus) identified in this work fit by the dashed red line, and embedded clusters (colored squares) in the catalogs of Lada et al. (1991); Carpenter et al. (1993); Lada & Lada (2003); Carpenter (2000); Kumar et al. (2006); Faustini et al. (2009) fit by the dashed black line. The slope for all is ≈0.33.
Current usage metrics show cumulative count of Article Views (full-text article views including HTML views, PDF and ePub downloads, according to the available data) and Abstracts Views on Vision4Press platform.
Data correspond to usage on the plateform after 2015. The current usage metrics is available 48-96 hours after online publication and is updated daily on week days.
Initial download of the metrics may take a while.