Fig. 14
Download original image
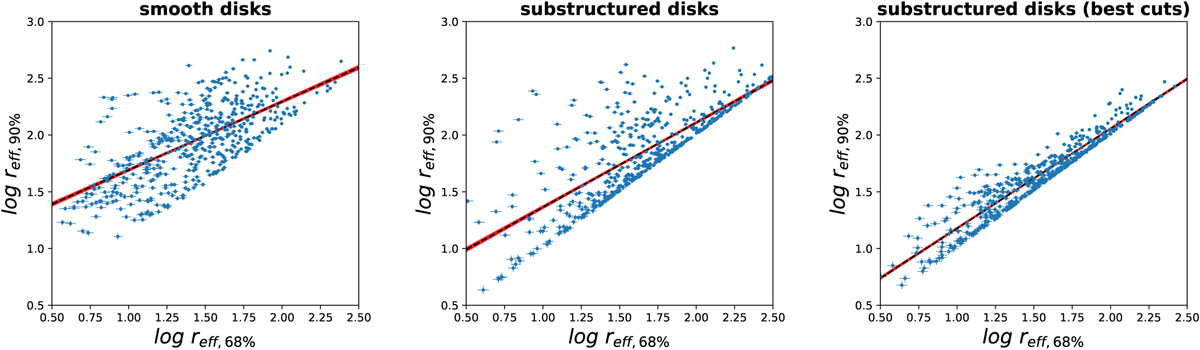
Comparison between log reff,90% and log reff,68% dust disk sizes for smooth disks (left panel), an entire set of substructured disks (middle panel), and substructured disks selected from our best case (i.e., 10−3.5 ⩽ α ⩽ 10−2.5, 10−2.3 M⋆ ⩽ Mdisk ⩽ 10−0.5 M⋆, υfrag ≥ 500 cm s−1, mp ≥ 150 M⊕, and rp ≤ 0.75 rc) (right plot). Blue dots represent a subset of the disks used in the estimate of the correlation between reff,90% and reff,68%. The best fit obtained exploiting the linmix implementation of the Bayesian linear regression method developed by Kelly (2007) is shown as a black line, with a 1σ confidence interval reported in red.
Current usage metrics show cumulative count of Article Views (full-text article views including HTML views, PDF and ePub downloads, according to the available data) and Abstracts Views on Vision4Press platform.
Data correspond to usage on the plateform after 2015. The current usage metrics is available 48-96 hours after online publication and is updated daily on week days.
Initial download of the metrics may take a while.