Fig. 13
Download original image
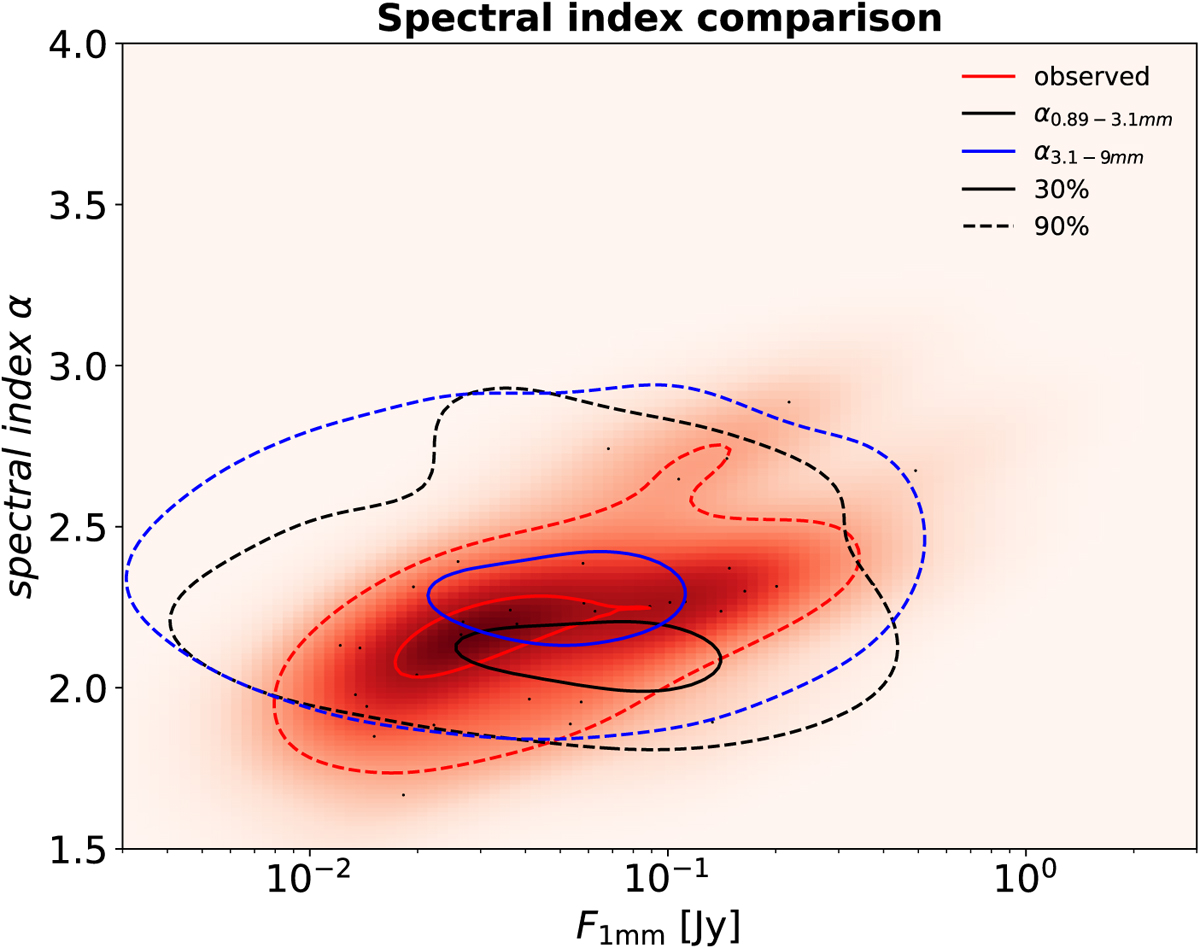
Spectral index distribution simulated substructured disks, selecting simulated disks with: 10−35 ⩽ α ⩽ 10−25, 10−23 M⋆ ⩽ Mdisk ⩽ 10−0.5 M⋆, υfrag ≥ 500 cm s−1, mp ≥ 150 M⊕, and rp ≤ 0 75 rc. The heat map represents the spectral index distribution of the observed disks with the black dots representing each single observed disk. The black, blue, and red lines refer to the simulated results obtained for α0.89-3.1 mm (black), the simulated results obtained for α3.1-9 mm (blue), and the observational results (α0.89-3.1 mm) (red). The continuous lines encompass the 30% of the cumulative sum of the disks produced from the simulations or observed. The dashed lines encompass the 90% of the cumulative sum of the disks produced from the simulations or observed.
Current usage metrics show cumulative count of Article Views (full-text article views including HTML views, PDF and ePub downloads, according to the available data) and Abstracts Views on Vision4Press platform.
Data correspond to usage on the plateform after 2015. The current usage metrics is available 48-96 hours after online publication and is updated daily on week days.
Initial download of the metrics may take a while.