Fig. 10
Download original image
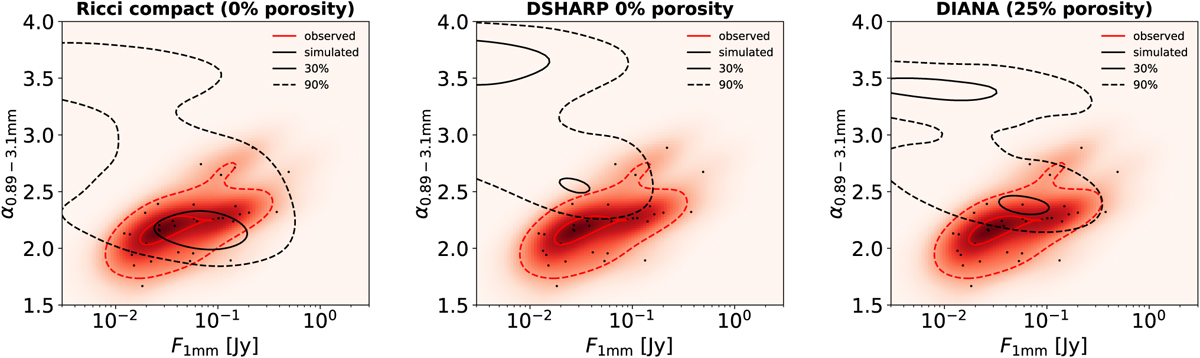
Spectral index distribution simulated substructured disks, for the entire parameter space of initial conditions (Table 2) for three different opacities. The heat map represents the spectral index distribution of the observed disks with the black dots representing each single observed disk. The black and red lines refer to the simulated results and the observational results, respectively. The continuous lines encompass the 30% of the cumulative sum of the disks produced from the simulations or observed. The dashed lines encompass the 90% of the cumulative sum of the disks produced from the simulations or observed. Left plot: spectral index distribution simulated substructured disks. The opacities model adopted for the simulated disks reported in this plot is the Ricci opacity model (Ricci et al. 2010b) with compact grains (Ricci compact model) as in Rosotti et al. (2019a) (0% grain porosity). Middle plot: spectral index distribution simulated substructured disks. The opacities model adopted for the simulated disks reported in this plot is the DSHARP (Birnstiel et al. 2018) model with 0% grain porosity. Right plot: spectral index distribution simulated substructured disks. The opacities model adopted for the simulated disks reported in this plot is the DIANA (Woitke et al. 2016) model (25% grain porosity).
Current usage metrics show cumulative count of Article Views (full-text article views including HTML views, PDF and ePub downloads, according to the available data) and Abstracts Views on Vision4Press platform.
Data correspond to usage on the plateform after 2015. The current usage metrics is available 48-96 hours after online publication and is updated daily on week days.
Initial download of the metrics may take a while.