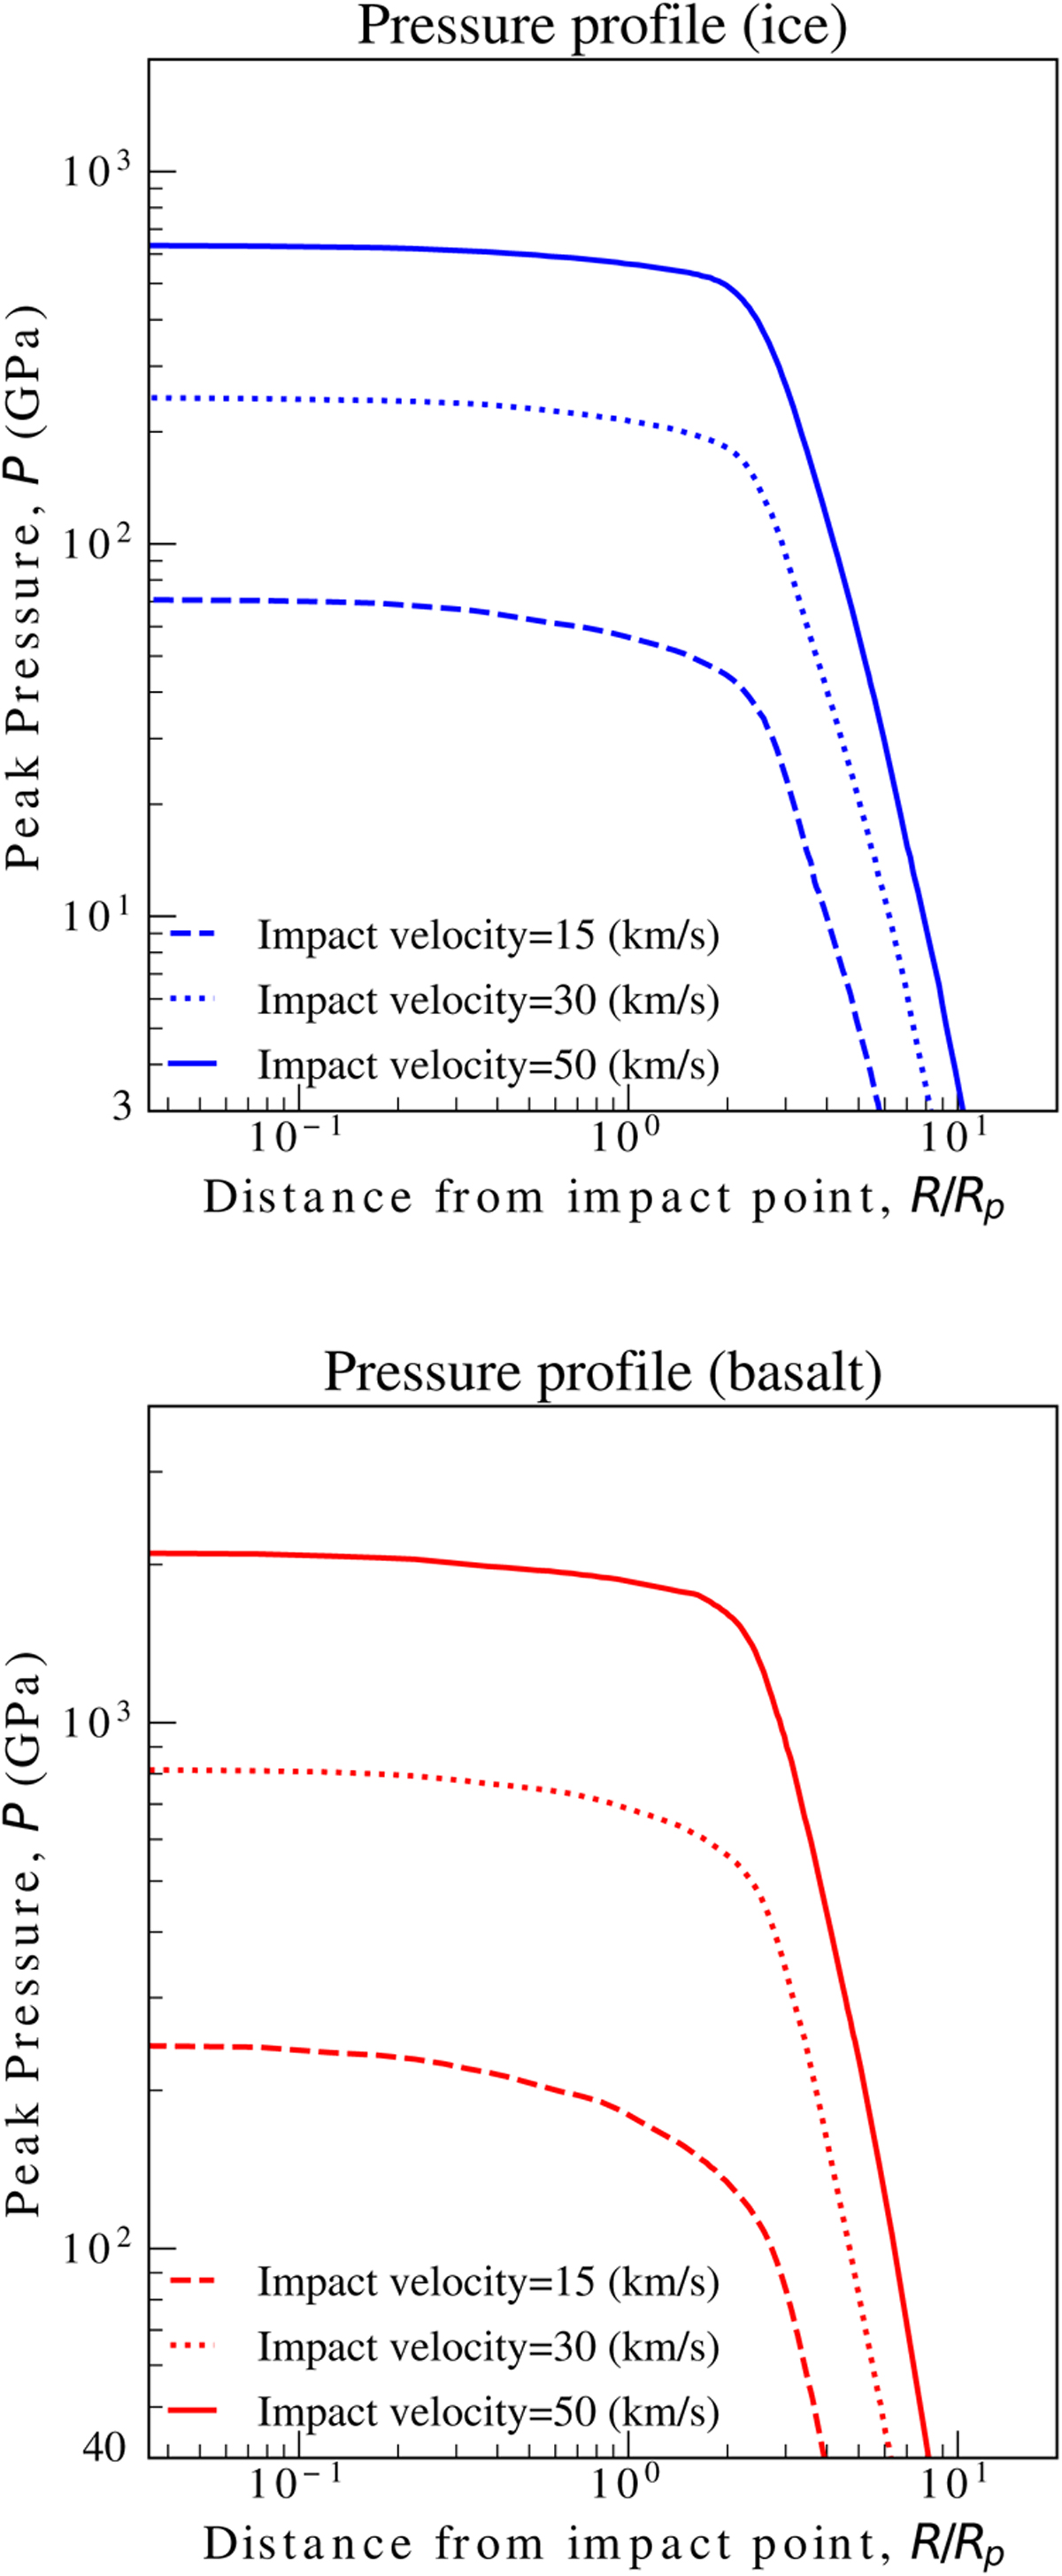
Fig. 3
Download original image
Peak pressure profile formed by the shock compression as a function of distance from the impact point along the vertical axis. The distance is characterized by projectile radius Rp. We note that the vertical value, peak pressure, is not a pressure at each time but the maximum pressure reached at each point. Tracer particles along with a white arrow (Fig. 2) record maximum pressure as a function of initial position, and these values are shown here.
Current usage metrics show cumulative count of Article Views (full-text article views including HTML views, PDF and ePub downloads, according to the available data) and Abstracts Views on Vision4Press platform.
Data correspond to usage on the plateform after 2015. The current usage metrics is available 48-96 hours after online publication and is updated daily on week days.
Initial download of the metrics may take a while.