Open Access
Fig. 14
Download original image
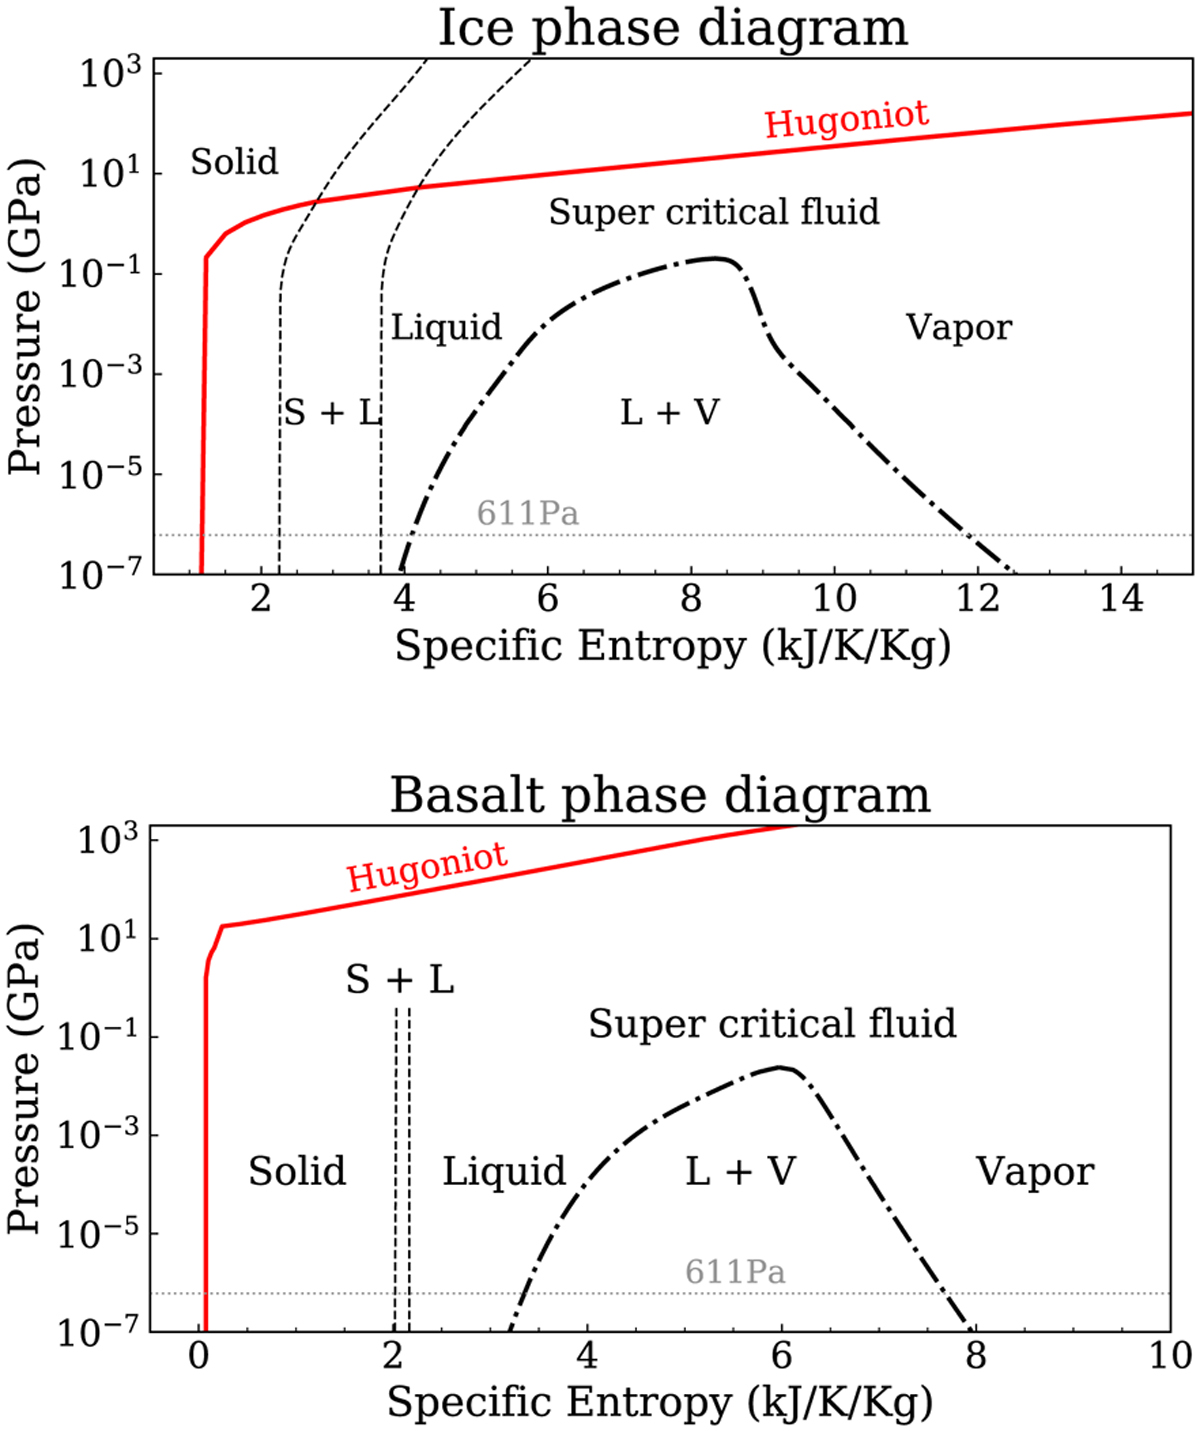
Phase diagram for water ice and basalt from the ANEOS (Turtle & Pierazzo 2001; Pierazzo et al. 2005) with the Hugoniot curves (red line). The dotted line and dash-dotted lines correspond to the phase boundary for solid-liquid and liquid-vapor, respectively.
Current usage metrics show cumulative count of Article Views (full-text article views including HTML views, PDF and ePub downloads, according to the available data) and Abstracts Views on Vision4Press platform.
Data correspond to usage on the plateform after 2015. The current usage metrics is available 48-96 hours after online publication and is updated daily on week days.
Initial download of the metrics may take a while.