Fig. 11
Download original image
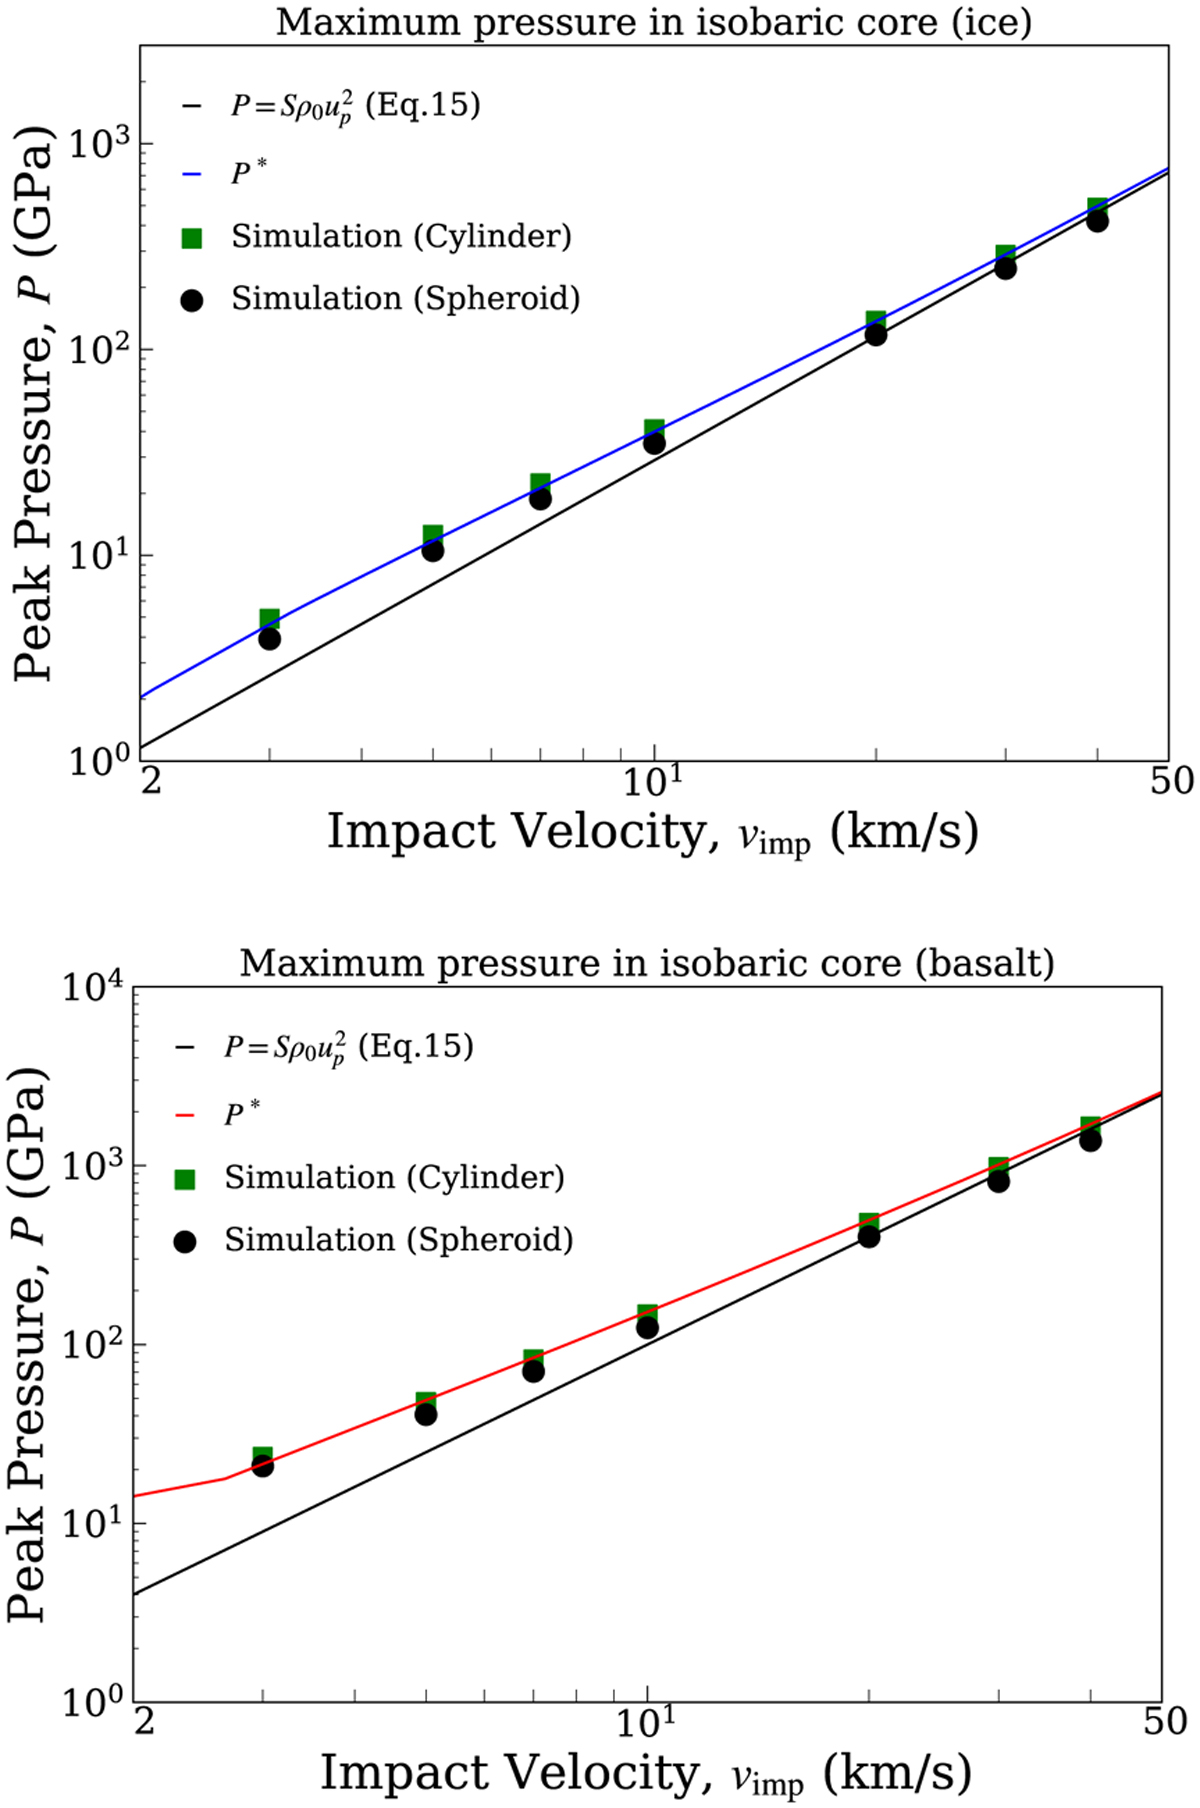
Comparison between analytical solutions and simulation results. The peak pressures of these plots are recorded in the nearest tracer particle to the impact point. The shape and color of the markers in the plots correspond to projectile shape: cylinder (green square) and spheroid (black circle). The simulation with the cylinder projectile is the same as that shown in Fig. 9. Solid lines are illustrated by Eq. (15) and P* (Sect. 4.3).
Current usage metrics show cumulative count of Article Views (full-text article views including HTML views, PDF and ePub downloads, according to the available data) and Abstracts Views on Vision4Press platform.
Data correspond to usage on the plateform after 2015. The current usage metrics is available 48-96 hours after online publication and is updated daily on week days.
Initial download of the metrics may take a while.