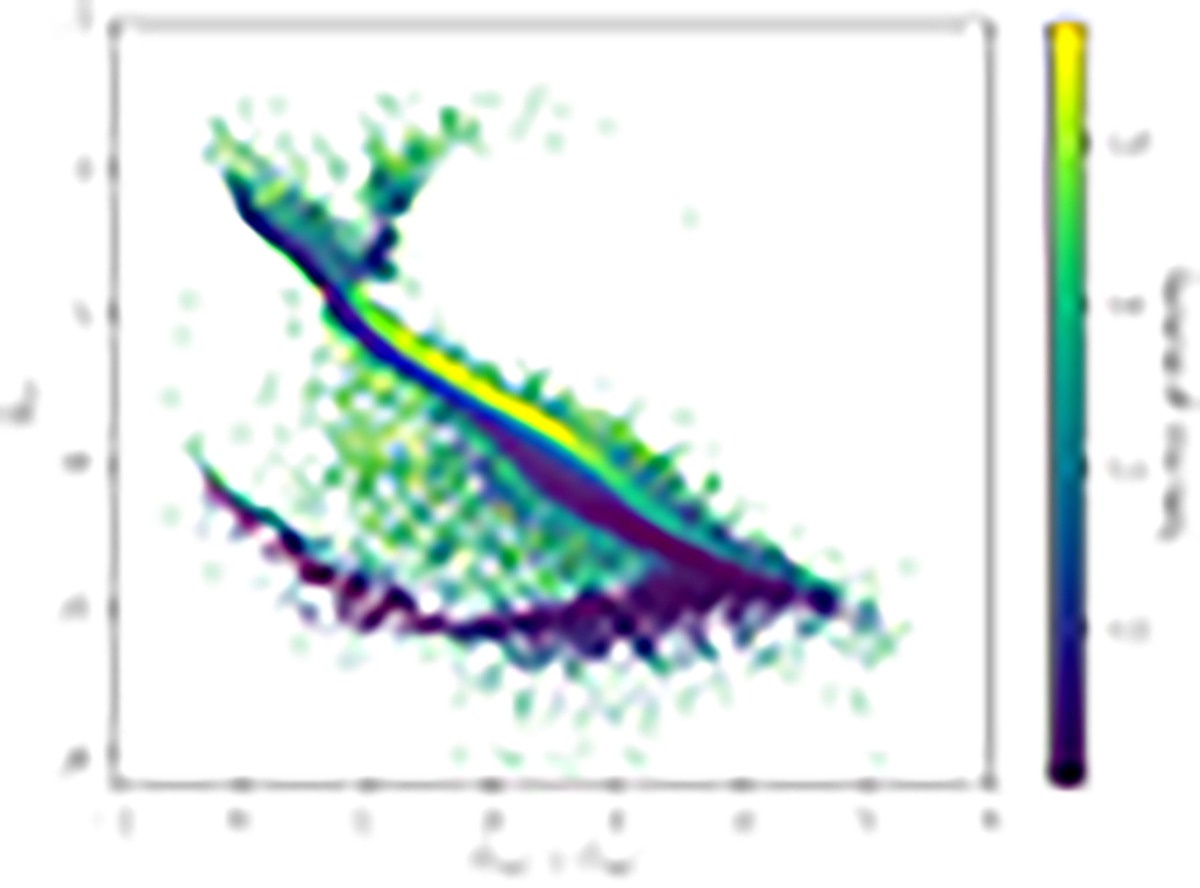
Fig. 7.
Download original image
Selection probability of the GCNS sources with RUWEs larger than our threshold shown in Fig. 3 across the colour–magnitude diagram. For the MS and WD sequence, we see a gradient on the selection probability for bins at the same GBP − GRP colour. The region between the MS and the WD sequence, which contains the MS–WD binaries, has a high concentration of sources marked as having poor astrometric solutions in the GCNS.
Current usage metrics show cumulative count of Article Views (full-text article views including HTML views, PDF and ePub downloads, according to the available data) and Abstracts Views on Vision4Press platform.
Data correspond to usage on the plateform after 2015. The current usage metrics is available 48-96 hours after online publication and is updated daily on week days.
Initial download of the metrics may take a while.