Open Access
Fig. 2.
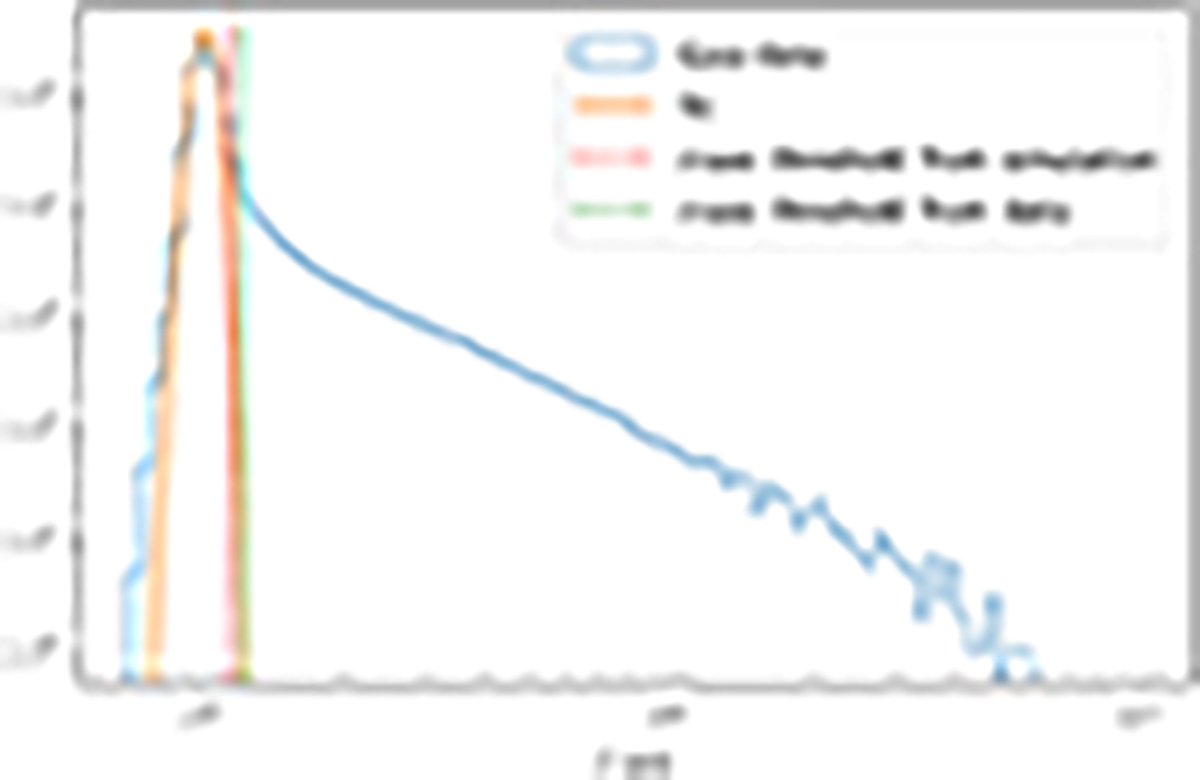
Download original image
Histogram of RUWEs for sources in the Gaia archive (blue line) HEALPix centred at l = 73.58°, b = 3.17°. The solid orange line indicates our fit of the single-source population in that HEALPix. The dotted lines indicate the RUWE thresholds for single sources with (green) and without (red) crowding effects.
Current usage metrics show cumulative count of Article Views (full-text article views including HTML views, PDF and ePub downloads, according to the available data) and Abstracts Views on Vision4Press platform.
Data correspond to usage on the plateform after 2015. The current usage metrics is available 48-96 hours after online publication and is updated daily on week days.
Initial download of the metrics may take a while.